

Answered step by step
Verified Expert Solution
Question
1 Approved Answer
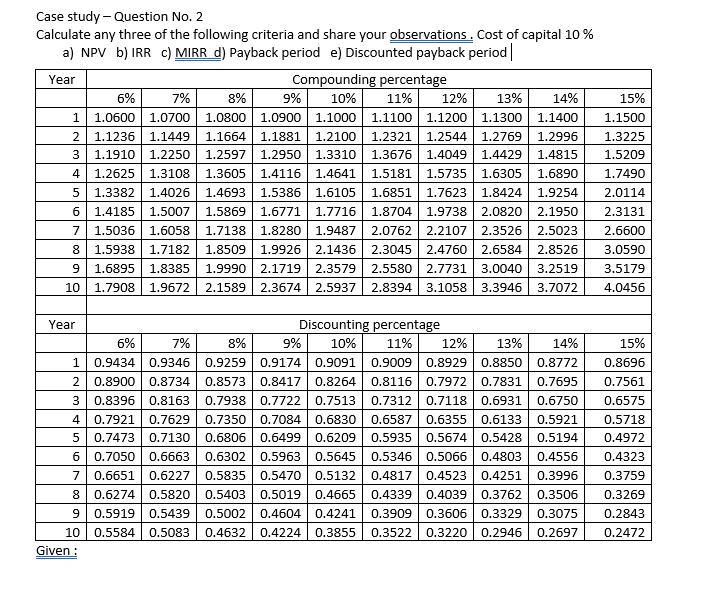
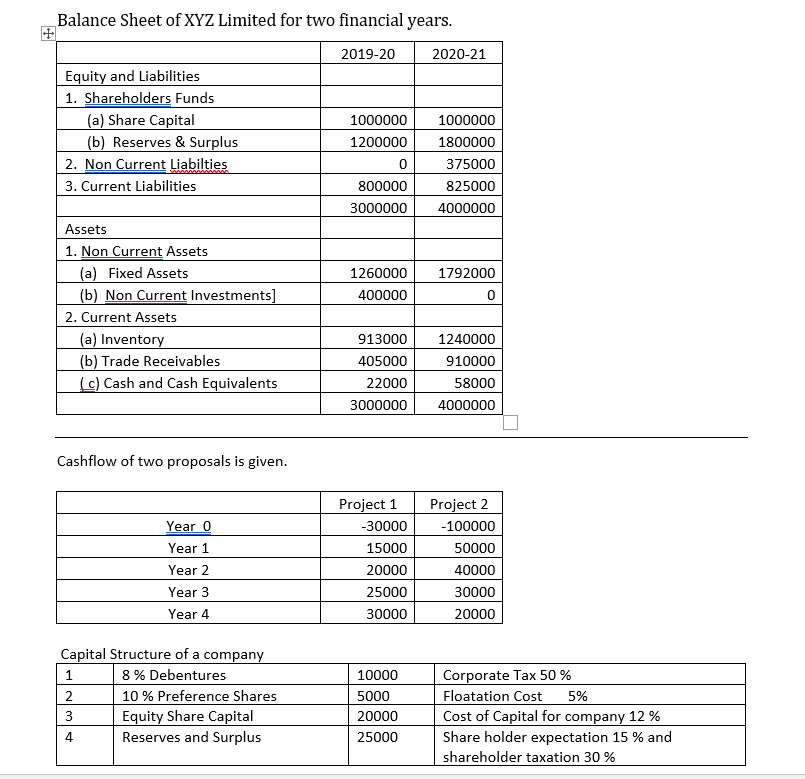
15% Case study - Question No. 2 Calculate any three of the following criteria and share your observations. Cost of capital 10% a) NPV b)
Step by Step Solution
There are 3 Steps involved in it
Step: 1

Get Instant Access to Expert-Tailored Solutions
See step-by-step solutions with expert insights and AI powered tools for academic success
Step: 2

Step: 3
Ace Your Homework with AI
Get the answers you need in no time with our AI-driven, step-by-step assistance
Get Started
Stock Market Trading For Beginners
Authors: Irvin Tarr
1st Edition
1491885327, 978-1491885321