Question
15.3 1. The following estimated regression equation based on 10 observations was presented. ? =29.1210+0.5906 x 1 +0.4580 x 2 The values of SST and
15.3
1.
The following estimated regression equation based on 10 observations was presented.
?=29.1210+0.5906x1+0.4580x2
The values of SST and SSR are6,713.125and6,224.375, respectively.
(a)
Find SSE.
SSE =
(b)
ComputeR2. (Round your answer to three decimal places.)
R2=
(c)
ComputeRa2.
(Round your answer to three decimal places.)
Ra2=
(d)
Comment on the goodness of fit. (For purposes of this exercise, consider a proportion large if it is at least 0.55.)
The estimated regression equation did not provide a good fit as a large proportion of the variability inyhas been explained by the estimated regression equation.
The estimated regression equation provided a good fit as a large proportion of the variability inyhas been explained by the estimated regression equation.
The estimated regression equation provided a good fit as a small proportion of the variability inyhas been explained by the estimated regression equation.
The estimated regression equation did not provide a good fit as a small proportion of the variability inyhas been explained by the estimated regression equation.
2.
The following estimated regression equation based on 30 observations was presented.
?= 17.6 + 3.8x1?2.3x2+ 7.6x3+ 2.7x4
The values of SST and SSR are1,803and1,759, respectively.
(a)
ComputeR2. (Round your answer to three decimal places.)
R2=
(b)
ComputeRa2.
(Round your answer to three decimal places.)
Ra2=
(c)
Comment on the goodness of fit. (For purposes of this exercise, consider a proportion large if it is at least 0.55.)
The estimated regression equation did not provide a good fit as a large proportion of the variability inyhas been explained by the estimated regression equation.
The estimated regression equation provided a good fit as a large proportion of the variability inyhas been explained by the estimated regression equation.
The estimated regression equation did not provide a good fit as a small proportion of the variability inyhas been explained by the estimated regression equation.
The estimated regression equation provided a good fit as a small proportion of the variability inyhas been explained by the estimated regression equation.
3.
The following estimated regression equation relating sales to inventory investment and advertising expenditures was given.
?=28+11x1+7x2
The data used to develop the model came from a survey of 10 stores; for those data,SST =16,000andSSR =12,640.
(a)
For the estimated regression equation given, computeR2.
R2=
(b)
ComputeRa2.
(Round your answer to two decimal places.)
Ra2=
(c)
Does the model appear to explain a large amount of variability in the data? Explain. (For purposes of this exercise, consider an amount large if it is at least 55%. Round your answer to the nearest integer.)
The adjusted coefficient of determination shows that% of the variability has been explained by the two independent variables; thus, we conclude that the model
---Select---
does
does not
explain a large amount of variability.
4.
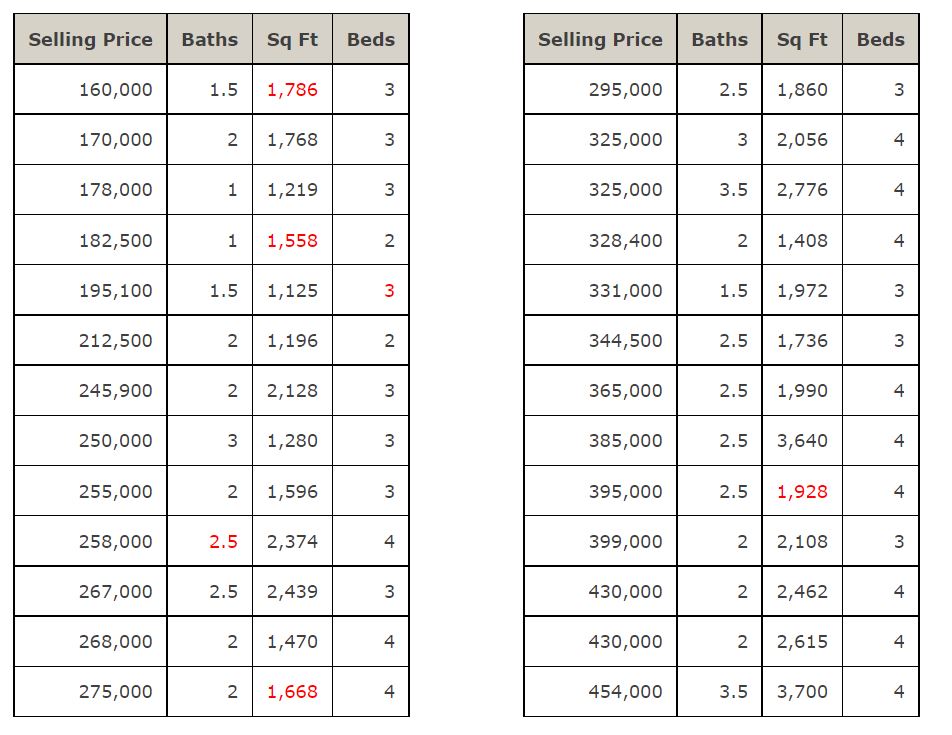
Spring is a peak time for selling houses. Suppose the data below contains the selling price, number of bathrooms, square footage, and number of bedrooms of 26 homes sold in Ft. Thomas, Kentucky, in spring 2018.

Step by Step Solution
There are 3 Steps involved in it
Step: 1

Get Instant Access to Expert-Tailored Solutions
See step-by-step solutions with expert insights and AI powered tools for academic success
Step: 2

Step: 3

Ace Your Homework with AI
Get the answers you need in no time with our AI-driven, step-by-step assistance
Get Started


