Answered step by step
Verified Expert Solution
Link Copied!

Question

1 Approved Answer

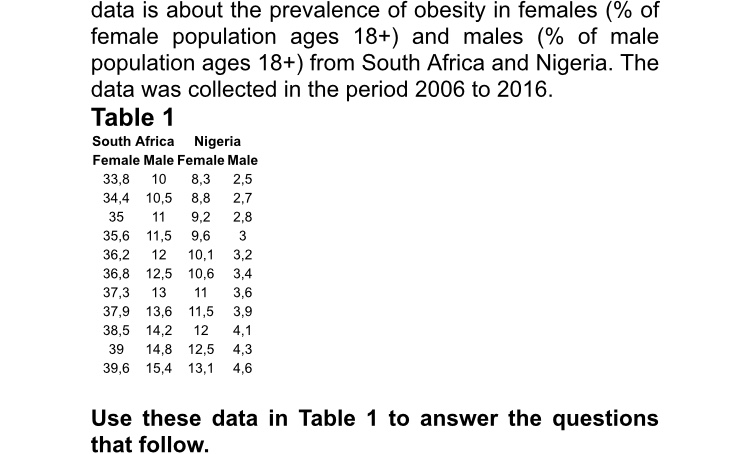
LDA 1.3 Estimate a discrimination function for the data in Table 1 using Fisher's discriminant methods. [15] 1.4 Does the discriminant model in 1.3 above

LDA

image text in transcribedimage text in transcribed
1.3 Estimate a discrimination function for the data in Table 1 using Fisher's discriminant methods. [15] 1.4 Does the discriminant model in 1.3 above separate the groups significantly? Confirm using Hoteling's test at 5% level of significance. Follow the hypothesis testing procedure. 171data is about the prevalence of obesity in females (% of female population ages 18+) and males (% of male population ages 18+) from South Africa and Nigeria. The data was collected in the period 2006 to 2016. Table 1 South Africa Nigeria Female Male Female Male 33,8 10 8.3 2,5 34.4 10,5 8.8 2,7 35 11 9.2 2.8 35,6 11,5 9,6 3 36,2 12 10.1 3,2 36,8 12,5 10,6 3,4 37,3 13 11 3,6 37,9 13,6 11,5 3,9 38,5 14,2 12 4.1 39 14,8 12,5 4.3 39,6 15,4 13,1 4.6 Use these data in Table 1 to answer the questions that follow

Step by Step Solution

There are 3 Steps involved in it

Step: 1

blur-text-image

Get Instant Access to Expert-Tailored Solutions

See step-by-step solutions with expert insights and AI powered tools for academic success

Step: 2

blur-text-image_2

Step: 3

blur-text-image_3

Ace Your Homework with AI

Get the answers you need in no time with our AI-driven, step-by-step assistance

Get Started

Recommended Textbook for

Mathematics Concepts With Applications

Authors: Charles P McKeague

1st Edition

1630983136, 9781630983130

More Books

Students also viewed these Mathematics questions

Question

Describe a persuasive message.

Answered: 1 week ago

Question

Identify and use the five steps for conducting research.

Answered: 1 week ago

Question

List the goals of a persuasive message.

Answered: 1 week ago