

Answered step by step
Verified Expert Solution
Question
1 Approved Answer
1.6 Plot the MTF on a single graph for each of the convolution filters shown below. 1.6 Plot the MTF on a single graph for
1.6 Plot the MTF on a single graph for each of the convolution filters shown below.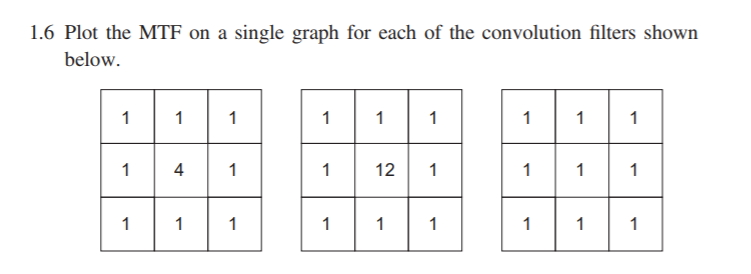
Step by Step Solution
There are 3 Steps involved in it
Step: 1

Get Instant Access to Expert-Tailored Solutions
See step-by-step solutions with expert insights and AI powered tools for academic success
Step: 2

Step: 3
Ace Your Homework with AI
Get the answers you need in no time with our AI-driven, step-by-step assistance
Get Started
A Beginners Guide To Google Drive And Docs Step By Step Practical Instructions To Google Drive Docs Sheets And Forms
Authors: Robert William
1st Edition
B085K8N4LN, 979-8615386251