

Question: 171 100% + i Case (1).pdf Coke versus Pepsi Case study: Please note that even though it is a team exercise, and you will be
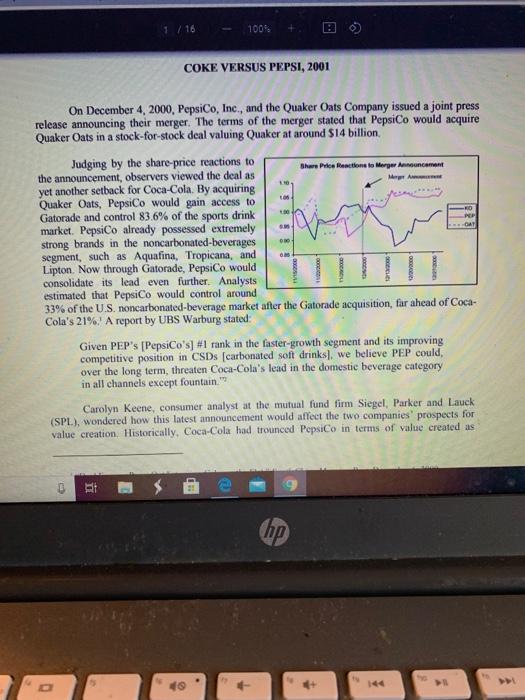
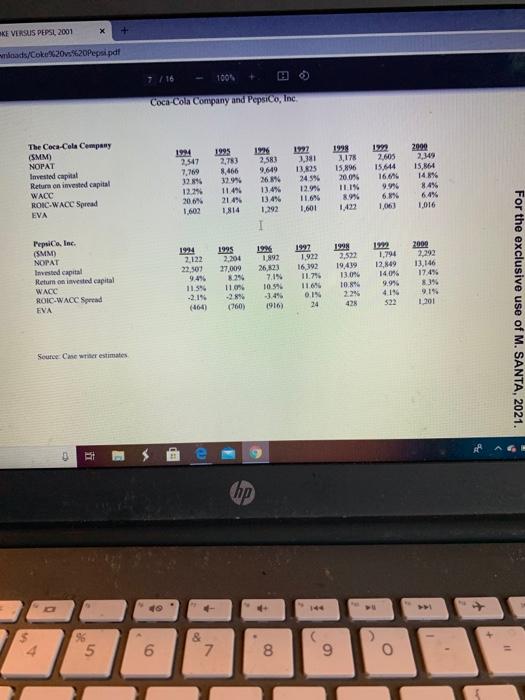
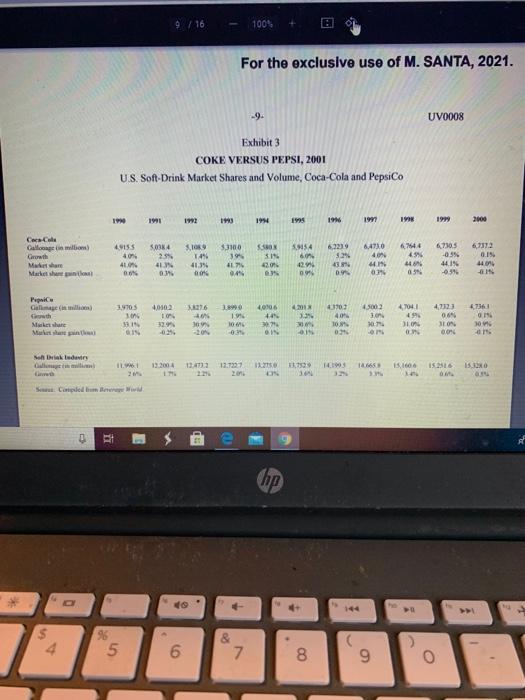
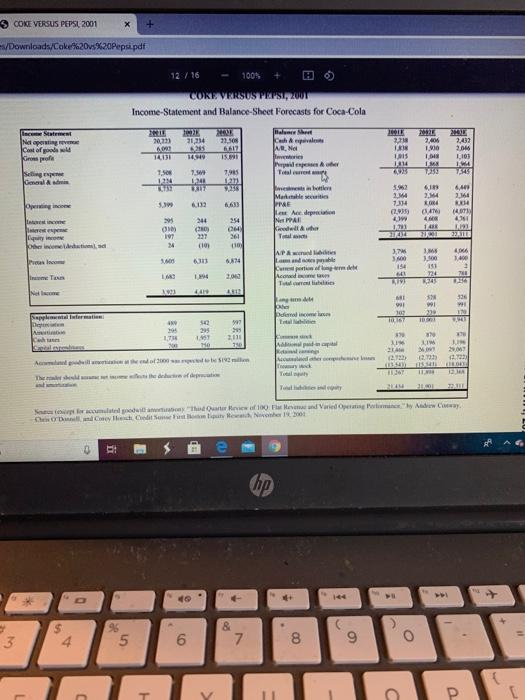
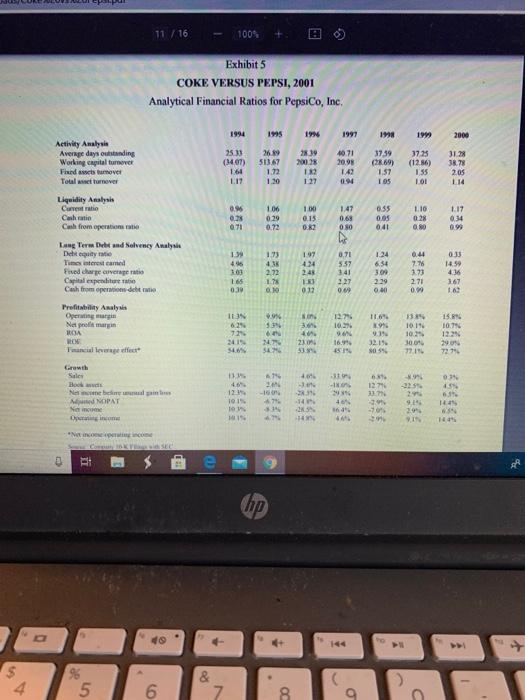
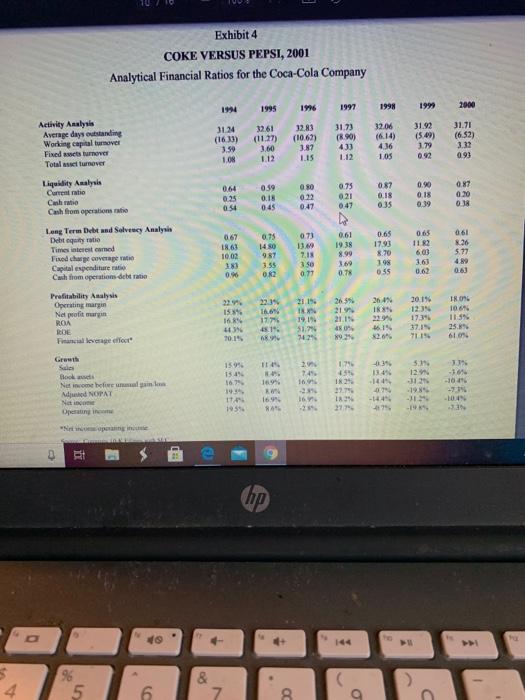


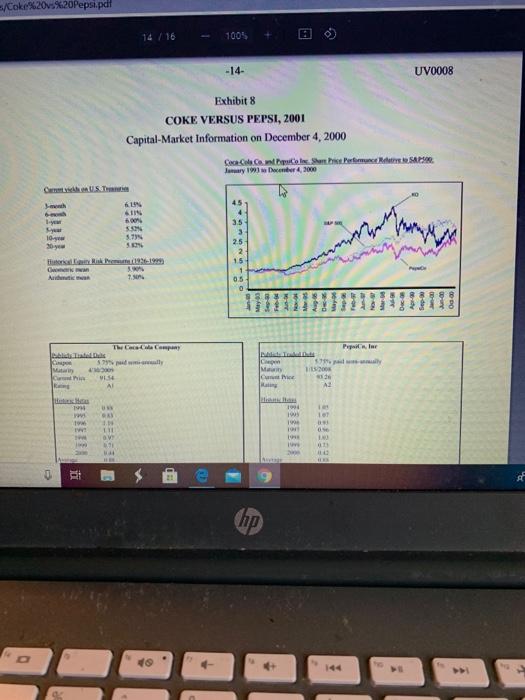
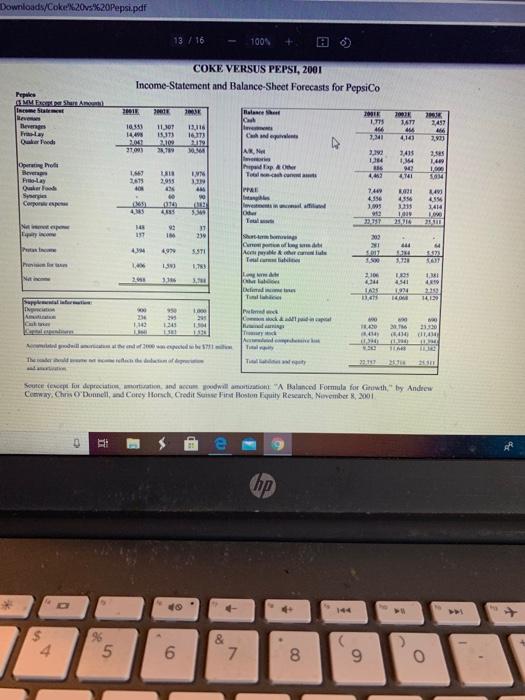
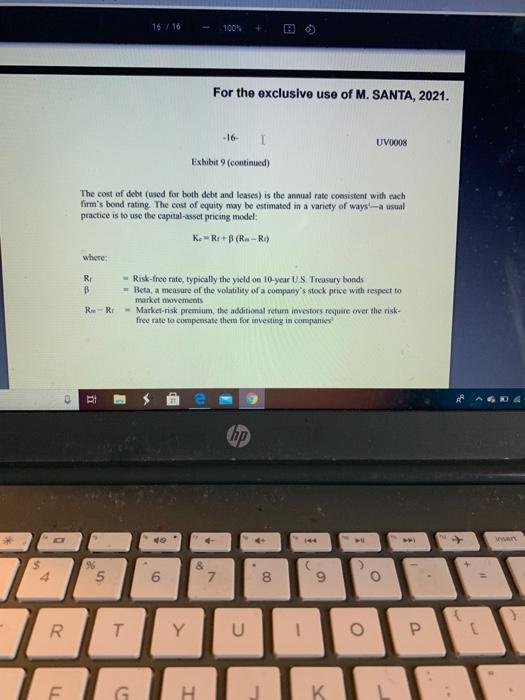
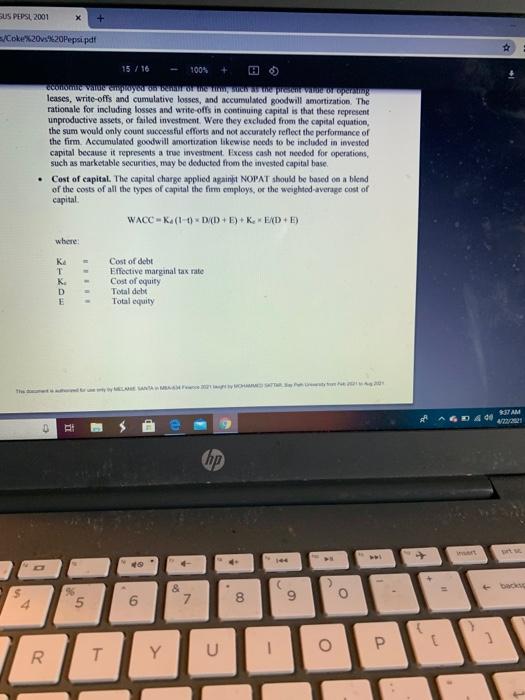
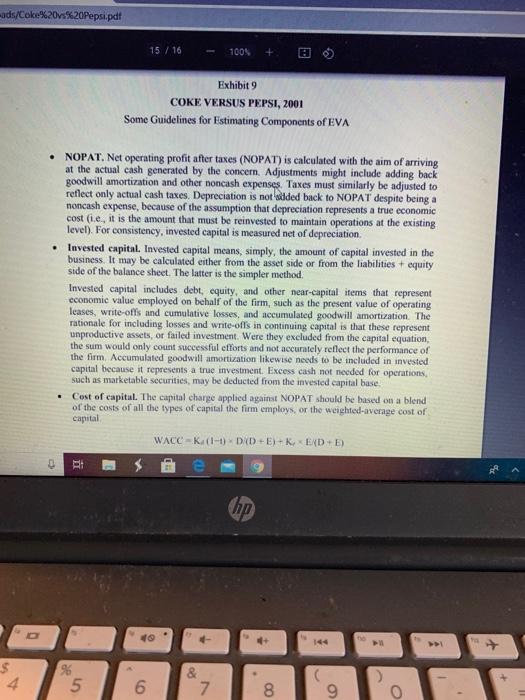
171 100% + i Case (1).pdf Coke versus Pepsi Case study: Please note that even though it is a team exercise, and you will be tempted to divide and conquer, it is extremely important that every member fully understands all aspects. If not, you will have partial learning and may struggle in the future courses, I Conduct an in-depth financial analysis: Note, first three questions are based on data in the case. The last two questions are based on using more current data (use Mergent data base) 1. EVA Analysis: Examine the historical performances of Coca-Cola and PepsiCo in terms of EVA; formula provided in the case study (Note: NOPAT is same as EBITAT or EBIT (1-tax rate) You should look under the hood, what is driving the EVA to be better or worse. For example EBIT is driven by parameters like Sales operating costs, and thus operating margins, etc. 2. Using Financial ratios from the case Examine the historical financial ratios, provide comparison, and again look at the elements of the numerator and denominator of the ratios. 3. Using your analysis in (1) and (2), which company would you chose? a. Extremely important that you support this answer with quantitative analysis, Le.. provide financial and analytical evidence to support your conclusions A. Now look at recent financial performance of these two companies, using Mergent data site on Bay Path Wbrary and provide your analysis of which company would up pick and why Does your company selection differ between prior data from the care and more recent data Support your conclusions e hop 0 3/16 100% brands-Coca-Cola, Fanta, Sprite, and Diet Coke-Daft and his executives worked hard to come up with new, noncarbonated products. Some analysts were optimistic that the change in management would return the Coca- Cola Company to its glory days. Perhaps through improved relations with bottlers and acquisitions of noncarbonated beverages, KO would return to the pre-1998 profit margins. Other analysts were less enthusiastic One thing was certain, however, with PepsiCo's invigorated management, KO would need to get back on its feet as quickly as it could Company Background: PepsiCo, Ine. In 2000, PepsiCo, Inc., was a $20 billion company involved in the snack food, soft drink, and noncarbonated beverage businesses. The company sold and distributed salty and sweet snacks under the Frito Lay trademark and manufactured concentrates of Pepsi, Mountain Dew, and other brands to sell to franchised bottlers. The company also produced and distributed juices and other noncarbonated beverages Snack foods accounted for roughly two-thirds of PepsiCo's sales and operating income, while beverages accounted for the remainder Positioning PepsiCo as a focused snack-and-beverage company in 2000 was due mostly to the efforts of Roger Enrico, CEO from 1996 to 2000. During his tenure, Enrico instituted a massive overhaul at PepsiCo. In 1997, he sold off the fast-food chains KFC, Taco Bell and Pizza Hut, ridding PepsiCo of a business that had long been a drag on returns. In 1999, he spun off Pepsi's capital-intensive bottling operations into an independent public company. By spinning of the bottling operations, PepsiCo would be left with just the higher-margin business of selling concentrate to bottlers. At the same time, independent PepsiCo bottlers would be able to raise capital on their own, freeing up cash flow within the parent company for other uses. Enrico also took aggressive steps to make PepsiCo a total beverage company. He brokered the acquisitions of Tropicana, the market leader in orange juice, and Ouaker Oats, whose Gatorade brand dominated the energy-drink market nanum Punit man hp 2 $ 08 3 5 6 7 8 9 O E 20 T Y 1 1/16 100% COKE VERSUS PEPSI, 2001 Share Price Reaction to Merger Anna On December 4, 2000, PepsiCo, Inc., and the Quaker Oats Company issued a joint press release announcing their merger. The terms of the merger stated that PepsiCo would acquire Quaker Oats in a stock-for-stock deal valuing Quaker at around $14 billion Judging by the share-price reactions to the announcement, observers viewed the deal as yet another setback for Coca-Cola. By acquiring Quaker Oats, PepsiCo would gain access to Gatorade and control 83.6% of the sports drink market. PepsiCo already possessed extremely strong brands in the noncarbonated-beverages segment, such as Aquafina, Tropicana, and Lipton. Now through Gatorade, PepsiCo would consolidate its lead even further. Analysts estimated that PepsiCo would control around 33% of the U.S. noncarbonated-beverage market after the Gatorade acquisition, far ahead of Coca- Cola's 21%. A report by UBS Warburg stated: Given PEP's (PepsiCo's] #1 rank in the faster-growth segment and its improving competitive position in CSDs (carbonated soft drinks), we believe PEP could, over the long term, threaten Coca-Cola's lead in the domestic beverage category in all channels except fountain." Carolyn Keene, consumer analyst at the mutual fund firm Siegel, Parker and Lauck (SPL), wondered how this latest announcement would affect the two companies prospects for value creation Historically. Coca-Cola had trounced PepsiCo in terms of value created as hp 0 > COKE VERSUS PE 2001 /DownloadCowoops 1001 For the exclusive use of M. SANTA, 2021. UVON Conclusion Coke and Pepsi had created one of the strongest rivalries in the story. Carolyn Keene now wanted to develop a view what the two companies are performances. She obtained pro forma projections for the two fimm from reports prepared by analyst Credit Suisse First Weston (Exhibits 6 and 7), and gathered information about our capital market conditions Exhibit). She also took out her gosdelines for estimating the components EVA Exhibit li would be nice to finish her analysis before going off for Christmas hak 9:35 AM A: E e hp 5 4 90 5 6 & 7 00 9 o R T COKE VERSUS PEPSL 2001 /Downloads/Coke%20v%20Peps.pdf 12 / 16 100% CORE VERSUS METSZOT Income-Statement and Balance Sheet Forecasts for Coca-Cola Halone 22.50 Cheval 5285 6612 MN 2013 20334 CES Ne posting Cost of goods Crows pola 2,06 1.910 2.419 304 14131 15. 16 103 1. 7.50 7.5 1959 Gold 124 1211 333 18 2.4 Torrent in bon Marbeit ME Le depreciation NAI Keluh T 592 2.4 7.334 (2013 Uw 21 6.40 2. H TI 4 . 244 295 OM 107 254 CH 261 4 141 AN con qy heim Pino 6.14 3. 300 154 APA be Comme Acom Tesis 3.500 151 734 1.400 7 2013 . 44 MI 136 WI app format he den T 107 167 30 191 295 10 TH 2010 70 Lud HO 2 . 23 000 115 367 for accumulated throw 100 Hd Video, www Des de CSI 2001 DI hp 40 S 4 5 6 & 7 8 9 T P 11 / 16 100% Exhibit 5 COKE VERSUS PEPSI, 2001 Analytical Financial Ratios for PepsiCo, Inc 7661 1995 19 1997 361 1999 2000 Activity Anahi Avere days olding Working capital turnover Find somover Total cover 2533 (14.07 164 26.89 513.67 1.72 1.30 22.19 2008 182 127 40.71 20.98 1.42 37.59 (2869) 1.57 IOS 3725 (12.56) 155 3128 38.78 205 114 10 1 90 Liquidity Analysis Carreto Cahatin Cash from operation to 106 0.29 0.72 100 0.15 0.62 1.47 0.69 OSO 0:55 0.05 041 1.10 0.28 O.NO 1.17 0.34 0.99 0.71 0.71 557 Long Term Debt and solvency Analysis Deity Time interest Gamed Freddare aveti Capital expenditure Cash from periode 1.39 445 103 165 0.39 1.73 43 2.72 1.78 0.10 197 434 248 1.33 012 1.24 654 3.00 2.39 0.00 0.44 7.75 3.73 2.71 0.99 0:35 14.59 436 167 160 327 0.69 NO Profitability Analysis Openingar Napoli HOA RON Taillefest IN 6:29 711 2411 54% * SVE M 127) 10. N 16.95 451 11.69 29 2.1 33 10194 10,29 15. 10.94 122 290 32.14 NIN WTS 230 53 300 054 77.11 Growth Sales 11 SU 3 UNE 63 127 -22 0.14 454 6.11 Ne mobilis NOPAT 2016 -In -7 - 121 10.15 2 -14 -2.5 14 409 SP -70% 2.1 2.11 On 119 144 ONUN. hp $ 4 5 9 & 7 8 9 Exhibit 4 COKE VERSUS PEPSI, 2001 Analytical Financial Ratios for the Coca-Cola Company 1995 1997 1998 6661 2000 Activity Analysis Avere days outstanding Working capital turnover Fixed acts over Total se tumover 3124 (1633) 3.50 1.08 31.71 (6.52) 32.61 (11.17) 3.60 1.12 32.83 (1062) 3.87 1.15 31.73 (890) 4.13 112 32.06 (6.14) 436 31.92 (5.49) 1.79 105 091 0.59 080 075 Liquidity Analysis Current ratio Cash ratio Cash from operations to 0.64 0.25 0:54 0.16 0.21 0.87 0.18 0.35 0.90 0.18 0.39 0.87 0.30 0.38 0.47 0:47 Long Term Debt und Solvency Analysis Det er to Times interest comed frudharyotage Capital expendituremat Cash from operations de train 067 18.63 10.03 0.61 19 18 0.75 140 9.87 3.55 02 0.73 130 7.13 350 0.77 8.99 0.65 17.93 8.70 198 055 0.65 1182 60 3.63 0.62 8.36 5.77 4.89 0.63 RT 69 0.6 0.78 Profitability Analysis Operating margin Net profit may ROA RE 154 16. 23:35 I. 1774 2119 IN 1919 51.7 265% 21.99 2119 40 2641 188 229% 46.19 2. 20.1% 123 17.34 37.1% TRON 1067 IN 25. 61 MET 10.15 TI 15.99 15. 167 2. 149 179 45 12 34 1349 -14 31 129 . 16.9% Growth S Book Net noe hele ANOPAT Netice Opng . -16 -1046 100 16 16. -1444 114 1955 IR 277 -1939 - -1 NEC p hp 49 4 96 5 6. & 7 8 9 2 Downloads/Cok s%20Pepsi.pdf 13/16 100 COKE VERSUS PEPSI, 2001 Income-Statement and Balance Sheet Forecasts for PepsiCo Peplice MESSA IK 2016 11.307 Rev Beverages Fry Der Tode 2003 13.116 1607 10343 14 041 27.00 444 1,141 1ATT 44 4141 7,497 186 2,73 100 379 MU 2 3415 1,164 Opto Bever AK, help Other Tech 2 Ses 1.49 1.000 IMN UI 2015 4,42 1.469 2679 40 11 JAPAI Data Swag Corpo LAN 40 010 455 M 4.18 7400 4.56 2.995 90 CHE aff 4 1,414 3. 25714 BIT 92 IM 197 31 239 NI 499 S.STI Com | als Tel. 30 SAT 13 210 Net 2013 316 1803 4.41 4x10 Jo Tui 14. HI 950 Ir Am 23 1.140 1341 ch 1. 1.100 M 23.30 VI1,034 2014 TES Thermal 21 Soute den for depreciation wind.com odwill amount "A Balanced Formula for Growth by Andrew Coway, Chris O'Donnell, and Corey Honch Credit Sunne Fint Hoston quity Research, November 82001 it hp 5 6 7 CO 9 O X KE VERSUS PEPSL, 2001 loads/Coke 620620Pepsi.pdf 1004 Coca-Cola Company and PepsiCo, Inc. 1994 2.589 The Coca-Cola Company (SMM) NOPAT Invested capital Return on invested capital WACC ROC WACC Spread EVA 2.547 7.769 1384 12.29 20.6% 1.602 1995 2,783 8,466 32.95 1149 214% 1.814 9.649 26. 13.4% 13.4% 1,292 1922 381 13.25 24596 12.9% 11.6% 1998 2,178 15,896 200% THIS 89% 1.422 1 2.60 15.544 16.6% 9.99% 2009 2,349 15,164 14.8% 8.4% 6.4% 1,016 6. 1.601 1.063 PepsiCo, Inc. (SMM) NOPAT 1892 26.23 19 1,794 12 849 1914 2.122 22 507 9.4% 11.54 -219 (464) 1995 2204 27,009 2 11. -2.8% (760) Invested capital Return on invested capital WACC ROIC-WACC Spread EVA 14,0% 1999 2.522 19.439 13.0% 10244 22 42 1.922 16 102 11.7% 11 0.1% 24 2009 7,292 13.146 17.4% 23% 914 1201 10.5 3.4% 1916) 904 414 For the exclusive use of M. SANTA, 2021. Source Case wir estimates $ 9 + + 5 6 7 00 9 9 / 16 100% For the exclusive use of M. SANTA, 2021. UV0008 Exhibit 3 COKE VERSUS PEPSI, 2001 U.S. Soft Drink Market Shares and Volume, Coca-Cola and PepsiCo M61 1995 19 1997 MAI MIT 2000 SO4 6.3239 Ceca Gallein wom Growth More Mackets 4935 40 4. 3.10 14 41.35 DOCS ME VIP SON SIN 59154 6.05 49 09 67644 49% 6,4730 40 4. N5 MET 67305 -0.59 44.1% -0.5 6,772 0.15 440 - NEI SEO 0.49 NED 03 Pupic Get) Geowth Machen 4736 SOLS'E WE COROT 901 TE WT 4,0306 44 2.90 19 10046 02 07 40 TON OM 47041 499 45002 3.0 10 47323 004 BION Don 10 f 329 -0% TE WE SI son 20 ON ON Yu- ON Sa ikadantry Calamuralia 13.2004 13:43 12.7227 14993 1665 S. 160 OCESI Seu Compleur 0 dy 14 4 5 6 7 00 8 9 9 O RSUS PEPSL 2001 %20v%20Pepti.pdf 14/16 100 Arde 130 05 O The Cece Tell $19. My 154 At Co M MUI them M A1 4 30 611 11 19 w 18 19 w ow TAI MI 300 RE A P. Dunia IL BIH LO BE 25 I 963 11 0.13 013 IS 015 WS to D IT RE FEE 5 * 1 wa O LE 0 i ho 5 6 LO 7 8 9 0 %20v-%20Pepsi.pd! 100% -14- UV0008 Exhibit 8 COKE VERSUS PEPSI, 2001 Capital-Market Information on December 4, 2000 Call Shoes SA Juary 1991 December 4, 2000 sen 5.79 3.5 3 25 2 15 1 05 0 The Case Company Poplar Lates 113 2008 Chi MES AL AD 199 1903 19 IT OV 21 $ hip Downloads/Cok s%20Pepsi.pdf 13/16 100 COKE VERSUS PEPSI, 2001 Income-Statement and Balance Sheet Forecasts for PepsiCo Peplice MESSA IK 2016 11.307 Rev Beverages Fry Der Tode 2003 13.116 1607 10343 14 041 27.00 444 1,141 1ATT 44 4141 7,497 186 2,73 100 379 MU 2 3415 1,164 Opto Bever AK, help Other Tech 2 Ses 1.49 1.000 IMN UI 2015 4,42 1.469 2679 40 11 JAPAI Data Swag Corpo LAN 40 010 455 M 4.18 7400 4.56 2.995 90 CHE aff 4 1,414 3. 25714 BIT 92 IM 197 31 239 NI 499 S.STI Com | als Tel. 30 SAT 13 210 Net 2013 316 1803 4.41 4x10 Jo Tui 14. HI 950 Ir Am 23 1.140 1341 ch 1. 1.100 M 23.30 VI1,034 2014 TES Thermal 21 Soute den for depreciation wind.com odwill amount "A Balanced Formula for Growth by Andrew Coway, Chris O'Donnell, and Corey Honch Credit Sunne Fint Hoston quity Research, November 82001 it hp 5 6 7 CO 9 O 16/16 100% For the exclusive use of M. SANTA, 2021. -16- 1 UV0008 Exhibit 9 (continued) The cost of debt (used for both debt and leases) is the annual rate consistent with each firm's bond rating. The cost of equity may be estimated in a variety of ways-a usual practice is to use the capital-asset pricing model Ke-RB (R.-R) where: RI - Risk-free rate, typically the yield on 10-year US Treasury bonds B = Beta, a measure of the volatility of a company's stock price with respect to market movements Re-Ri - Market-risk premium, the additional return investors require over the risk- free rate to compensate them for investing in companies RI hp O 5 6 7 00 9 O 20 T Y U 1 O P G H K SUS PEPSL 2001 /Co2013%20Pepsipdf 15/16 100% Vand up alorrig leases, write-offs and cumulative losses, and accumulated goodwill amortization. The rationale for including losses and write-offs in continuing capital is that these represent unproductive assets, or failed investment. Were they excluded from the capital equation, the sum would only count successful efforts and not accurately reflect the performance of the firm. Accumulated goodwill amortization likewise needs to be included in invested capital because it represents a true investment. Excess cash not needed for operations, such as marketable securities, may be deducted from the invested capital base Cost of capital. The capital charge applied against NOPAT should be based on a blend of the costs of all the types of capital the firm employs or the weighted average cost of capital WACC-K(1-1) D/(D+E) + K EXD+E) where T K D E Cost of debt Effective marginal tax rate Cost of equity Total debt Total equity AM 0 RI hp . 8 7 o 9 6 4 5 00 2 P O 20 T Y U 20%20Pepsi.pdf 15 / 16 100% Exhibit 9 COKE VERSUS PEPSI, 2001 Some Guidelines for Estimating Components of EVA NOPAT. Net operating profit after taxes (NOPAT) is calculated with the aim of arriving at the actual cash generated by the concern. Adjustments might include adding back goodwill amortization and other noncash expenses. Taxes must similarly be adjusted to reflect only actual cash taxes. Depreciation is not added back to NOPAT despite being a noncash expense, because of the assumption that depreciation represents a true economic cost (.e., it is the amount that must be reinvested to maintain operations at the existing level). For consisteney, invested capital is measured net of depreciation lavested capital. Invested capital means, simply, the amount of capital invested in the business. It may be calculated either from the asset side or from the liabilities + equity side of the balance sheet. The latter is the simpler method. Invested capital includes debt, equity, and other near-capital items that represent economic value employed on behalf of the firm, such as the present value of operating leases, write-offs and cumulative losses, and accumulated goodwill amortization. The rationale for including losses and write-offs in continuing capital is that these represent unproductive assets, or failed investment. Were they excluded from the capital equation, the sum would only count successful efforts and not accurately reflect the performance of the firm Accumulated goodwill amortization likewise needs to be included in invested capital because it represents a true investment. Excess cash not needed for operations, such as marketable securities, may be deducted from the invested capital base. Cost of capital. The capital charge applied against NOPAT should be based on a blend of the costs of all the types of capital the firm employs, or the weighted average cost of capital WACC-k (1-1) D D+E+KENDE) . AI e hp $ 4. % 5 6 6 & 7 8 9 O 171 100% + i Case (1).pdf Coke versus Pepsi Case study: Please note that even though it is a team exercise, and you will be tempted to divide and conquer, it is extremely important that every member fully understands all aspects. If not, you will have partial learning and may struggle in the future courses, I Conduct an in-depth financial analysis: Note, first three questions are based on data in the case. The last two questions are based on using more current data (use Mergent data base) 1. EVA Analysis: Examine the historical performances of Coca-Cola and PepsiCo in terms of EVA; formula provided in the case study (Note: NOPAT is same as EBITAT or EBIT (1-tax rate) You should look under the hood, what is driving the EVA to be better or worse. For example EBIT is driven by parameters like Sales operating costs, and thus operating margins, etc. 2. Using Financial ratios from the case Examine the historical financial ratios, provide comparison, and again look at the elements of the numerator and denominator of the ratios. 3. Using your analysis in (1) and (2), which company would you chose? a. Extremely important that you support this answer with quantitative analysis, Le.. provide financial and analytical evidence to support your conclusions A. Now look at recent financial performance of these two companies, using Mergent data site on Bay Path Wbrary and provide your analysis of which company would up pick and why Does your company selection differ between prior data from the care and more recent data Support your conclusions e hop 0 3/16 100% brands-Coca-Cola, Fanta, Sprite, and Diet Coke-Daft and his executives worked hard to come up with new, noncarbonated products. Some analysts were optimistic that the change in management would return the Coca- Cola Company to its glory days. Perhaps through improved relations with bottlers and acquisitions of noncarbonated beverages, KO would return to the pre-1998 profit margins. Other analysts were less enthusiastic One thing was certain, however, with PepsiCo's invigorated management, KO would need to get back on its feet as quickly as it could Company Background: PepsiCo, Ine. In 2000, PepsiCo, Inc., was a $20 billion company involved in the snack food, soft drink, and noncarbonated beverage businesses. The company sold and distributed salty and sweet snacks under the Frito Lay trademark and manufactured concentrates of Pepsi, Mountain Dew, and other brands to sell to franchised bottlers. The company also produced and distributed juices and other noncarbonated beverages Snack foods accounted for roughly two-thirds of PepsiCo's sales and operating income, while beverages accounted for the remainder Positioning PepsiCo as a focused snack-and-beverage company in 2000 was due mostly to the efforts of Roger Enrico, CEO from 1996 to 2000. During his tenure, Enrico instituted a massive overhaul at PepsiCo. In 1997, he sold off the fast-food chains KFC, Taco Bell and Pizza Hut, ridding PepsiCo of a business that had long been a drag on returns. In 1999, he spun off Pepsi's capital-intensive bottling operations into an independent public company. By spinning of the bottling operations, PepsiCo would be left with just the higher-margin business of selling concentrate to bottlers. At the same time, independent PepsiCo bottlers would be able to raise capital on their own, freeing up cash flow within the parent company for other uses. Enrico also took aggressive steps to make PepsiCo a total beverage company. He brokered the acquisitions of Tropicana, the market leader in orange juice, and Ouaker Oats, whose Gatorade brand dominated the energy-drink market nanum Punit man hp 2 $ 08 3 5 6 7 8 9 O E 20 T Y 1 1/16 100% COKE VERSUS PEPSI, 2001 Share Price Reaction to Merger Anna On December 4, 2000, PepsiCo, Inc., and the Quaker Oats Company issued a joint press release announcing their merger. The terms of the merger stated that PepsiCo would acquire Quaker Oats in a stock-for-stock deal valuing Quaker at around $14 billion Judging by the share-price reactions to the announcement, observers viewed the deal as yet another setback for Coca-Cola. By acquiring Quaker Oats, PepsiCo would gain access to Gatorade and control 83.6% of the sports drink market. PepsiCo already possessed extremely strong brands in the noncarbonated-beverages segment, such as Aquafina, Tropicana, and Lipton. Now through Gatorade, PepsiCo would consolidate its lead even further. Analysts estimated that PepsiCo would control around 33% of the U.S. noncarbonated-beverage market after the Gatorade acquisition, far ahead of Coca- Cola's 21%. A report by UBS Warburg stated: Given PEP's (PepsiCo's] #1 rank in the faster-growth segment and its improving competitive position in CSDs (carbonated soft drinks), we believe PEP could, over the long term, threaten Coca-Cola's lead in the domestic beverage category in all channels except fountain." Carolyn Keene, consumer analyst at the mutual fund firm Siegel, Parker and Lauck (SPL), wondered how this latest announcement would affect the two companies prospects for value creation Historically. Coca-Cola had trounced PepsiCo in terms of value created as hp 0 > COKE VERSUS PE 2001 /DownloadCowoops 1001 For the exclusive use of M. SANTA, 2021. UVON Conclusion Coke and Pepsi had created one of the strongest rivalries in the story. Carolyn Keene now wanted to develop a view what the two companies are performances. She obtained pro forma projections for the two fimm from reports prepared by analyst Credit Suisse First Weston (Exhibits 6 and 7), and gathered information about our capital market conditions Exhibit). She also took out her gosdelines for estimating the components EVA Exhibit li would be nice to finish her analysis before going off for Christmas hak 9:35 AM A: E e hp 5 4 90 5 6 & 7 00 9 o R T COKE VERSUS PEPSL 2001 /Downloads/Coke%20v%20Peps.pdf 12 / 16 100% CORE VERSUS METSZOT Income-Statement and Balance Sheet Forecasts for Coca-Cola Halone 22.50 Cheval 5285 6612 MN 2013 20334 CES Ne posting Cost of goods Crows pola 2,06 1.910 2.419 304 14131 15. 16 103 1. 7.50 7.5 1959 Gold 124 1211 333 18 2.4 Torrent in bon Marbeit ME Le depreciation NAI Keluh T 592 2.4 7.334 (2013 Uw 21 6.40 2. H TI 4 . 244 295 OM 107 254 CH 261 4 141 AN con qy heim Pino 6.14 3. 300 154 APA be Comme Acom Tesis 3.500 151 734 1.400 7 2013 . 44 MI 136 WI app format he den T 107 167 30 191 295 10 TH 2010 70 Lud HO 2 . 23 000 115 367 for accumulated throw 100 Hd Video, www Des de CSI 2001 DI hp 40 S 4 5 6 & 7 8 9 T P 11 / 16 100% Exhibit 5 COKE VERSUS PEPSI, 2001 Analytical Financial Ratios for PepsiCo, Inc 7661 1995 19 1997 361 1999 2000 Activity Anahi Avere days olding Working capital turnover Find somover Total cover 2533 (14.07 164 26.89 513.67 1.72 1.30 22.19 2008 182 127 40.71 20.98 1.42 37.59 (2869) 1.57 IOS 3725 (12.56) 155 3128 38.78 205 114 10 1 90 Liquidity Analysis Carreto Cahatin Cash from operation to 106 0.29 0.72 100 0.15 0.62 1.47 0.69 OSO 0:55 0.05 041 1.10 0.28 O.NO 1.17 0.34 0.99 0.71 0.71 557 Long Term Debt and solvency Analysis Deity Time interest Gamed Freddare aveti Capital expenditure Cash from periode 1.39 445 103 165 0.39 1.73 43 2.72 1.78 0.10 197 434 248 1.33 012 1.24 654 3.00 2.39 0.00 0.44 7.75 3.73 2.71 0.99 0:35 14.59 436 167 160 327 0.69 NO Profitability Analysis Openingar Napoli HOA RON Taillefest IN 6:29 711 2411 54% * SVE M 127) 10. N 16.95 451 11.69 29 2.1 33 10194 10,29 15. 10.94 122 290 32.14 NIN WTS 230 53 300 054 77.11 Growth Sales 11 SU 3 UNE 63 127 -22 0.14 454 6.11 Ne mobilis NOPAT 2016 -In -7 - 121 10.15 2 -14 -2.5 14 409 SP -70% 2.1 2.11 On 119 144 ONUN. hp $ 4 5 9 & 7 8 9 Exhibit 4 COKE VERSUS PEPSI, 2001 Analytical Financial Ratios for the Coca-Cola Company 1995 1997 1998 6661 2000 Activity Analysis Avere days outstanding Working capital turnover Fixed acts over Total se tumover 3124 (1633) 3.50 1.08 31.71 (6.52) 32.61 (11.17) 3.60 1.12 32.83 (1062) 3.87 1.15 31.73 (890) 4.13 112 32.06 (6.14) 436 31.92 (5.49) 1.79 105 091 0.59 080 075 Liquidity Analysis Current ratio Cash ratio Cash from operations to 0.64 0.25 0:54 0.16 0.21 0.87 0.18 0.35 0.90 0.18 0.39 0.87 0.30 0.38 0.47 0:47 Long Term Debt und Solvency Analysis Det er to Times interest comed frudharyotage Capital expendituremat Cash from operations de train 067 18.63 10.03 0.61 19 18 0.75 140 9.87 3.55 02 0.73 130 7.13 350 0.77 8.99 0.65 17.93 8.70 198 055 0.65 1182 60 3.63 0.62 8.36 5.77 4.89 0.63 RT 69 0.6 0.78 Profitability Analysis Operating margin Net profit may ROA RE 154 16. 23:35 I. 1774 2119 IN 1919 51.7 265% 21.99 2119 40 2641 188 229% 46.19 2. 20.1% 123 17.34 37.1% TRON 1067 IN 25. 61 MET 10.15 TI 15.99 15. 167 2. 149 179 45 12 34 1349 -14 31 129 . 16.9% Growth S Book Net noe hele ANOPAT Netice Opng . -16 -1046 100 16 16. -1444 114 1955 IR 277 -1939 - -1 NEC p hp 49 4 96 5 6. & 7 8 9 2 Downloads/Cok s%20Pepsi.pdf 13/16 100 COKE VERSUS PEPSI, 2001 Income-Statement and Balance Sheet Forecasts for PepsiCo Peplice MESSA IK 2016 11.307 Rev Beverages Fry Der Tode 2003 13.116 1607 10343 14 041 27.00 444 1,141 1ATT 44 4141 7,497 186 2,73 100 379 MU 2 3415 1,164 Opto Bever AK, help Other Tech 2 Ses 1.49 1.000 IMN UI 2015 4,42 1.469 2679 40 11 JAPAI Data Swag Corpo LAN 40 010 455 M 4.18 7400 4.56 2.995 90 CHE aff 4 1,414 3. 25714 BIT 92 IM 197 31 239 NI 499 S.STI Com | als Tel. 30 SAT 13 210 Net 2013 316 1803 4.41 4x10 Jo Tui 14. HI 950 Ir Am 23 1.140 1341 ch 1. 1.100 M 23.30 VI1,034 2014 TES Thermal 21 Soute den for depreciation wind.com odwill amount "A Balanced Formula for Growth by Andrew Coway, Chris O'Donnell, and Corey Honch Credit Sunne Fint Hoston quity Research, November 82001 it hp 5 6 7 CO 9 O X KE VERSUS PEPSL, 2001 loads/Coke 620620Pepsi.pdf 1004 Coca-Cola Company and PepsiCo, Inc. 1994 2.589 The Coca-Cola Company (SMM) NOPAT Invested capital Return on invested capital WACC ROC WACC Spread EVA 2.547 7.769 1384 12.29 20.6% 1.602 1995 2,783 8,466 32.95 1149 214% 1.814 9.649 26. 13.4% 13.4% 1,292 1922 381 13.25 24596 12.9% 11.6% 1998 2,178 15,896 200% THIS 89% 1.422 1 2.60 15.544 16.6% 9.99% 2009 2,349 15,164 14.8% 8.4% 6.4% 1,016 6. 1.601 1.063 PepsiCo, Inc. (SMM) NOPAT 1892 26.23 19 1,794 12 849 1914 2.122 22 507 9.4% 11.54 -219 (464) 1995 2204 27,009 2 11. -2.8% (760) Invested capital Return on invested capital WACC ROIC-WACC Spread EVA 14,0% 1999 2.522 19.439 13.0% 10244 22 42 1.922 16 102 11.7% 11 0.1% 24 2009 7,292 13.146 17.4% 23% 914 1201 10.5 3.4% 1916) 904 414 For the exclusive use of M. SANTA, 2021. Source Case wir estimates $ 9 + + 5 6 7 00 9 9 / 16 100% For the exclusive use of M. SANTA, 2021. UV0008 Exhibit 3 COKE VERSUS PEPSI, 2001 U.S. Soft Drink Market Shares and Volume, Coca-Cola and PepsiCo M61 1995 19 1997 MAI MIT 2000 SO4 6.3239 Ceca Gallein wom Growth More Mackets 4935 40 4. 3.10 14 41.35 DOCS ME VIP SON SIN 59154 6.05 49 09 67644 49% 6,4730 40 4. N5 MET 67305 -0.59 44.1% -0.5 6,772 0.15 440 - NEI SEO 0.49 NED 03 Pupic Get) Geowth Machen 4736 SOLS'E WE COROT 901 TE WT 4,0306 44 2.90 19 10046 02 07 40 TON OM 47041 499 45002 3.0 10 47323 004 BION Don 10 f 329 -0% TE WE SI son 20 ON ON Yu- ON Sa ikadantry Calamuralia 13.2004 13:43 12.7227 14993 1665 S. 160 OCESI Seu Compleur 0 dy 14 4 5 6 7 00 8 9 9 O RSUS PEPSL 2001 %20v%20Pepti.pdf 14/16 100 Arde 130 05 O The Cece Tell $19. My 154 At Co M MUI them M A1 4 30 611 11 19 w 18 19 w ow TAI MI 300 RE A P. Dunia IL BIH LO BE 25 I 963 11 0.13 013 IS 015 WS to D IT RE FEE 5 * 1 wa O LE 0 i ho 5 6 LO 7 8 9 0 %20v-%20Pepsi.pd! 100% -14- UV0008 Exhibit 8 COKE VERSUS PEPSI, 2001 Capital-Market Information on December 4, 2000 Call Shoes SA Juary 1991 December 4, 2000 sen 5.79 3.5 3 25 2 15 1 05 0 The Case Company Poplar Lates 113 2008 Chi MES AL AD 199 1903 19 IT OV 21 $ hip Downloads/Cok s%20Pepsi.pdf 13/16 100 COKE VERSUS PEPSI, 2001 Income-Statement and Balance Sheet Forecasts for PepsiCo Peplice MESSA IK 2016 11.307 Rev Beverages Fry Der Tode 2003 13.116 1607 10343 14 041 27.00 444 1,141 1ATT 44 4141 7,497 186 2,73 100 379 MU 2 3415 1,164 Opto Bever AK, help Other Tech 2 Ses 1.49 1.000 IMN UI 2015 4,42 1.469 2679 40 11 JAPAI Data Swag Corpo LAN 40 010 455 M 4.18 7400 4.56 2.995 90 CHE aff 4 1,414 3. 25714 BIT 92 IM 197 31 239 NI 499 S.STI Com | als Tel. 30 SAT 13 210 Net 2013 316 1803 4.41 4x10 Jo Tui 14. HI 950 Ir Am 23 1.140 1341 ch 1. 1.100 M 23.30 VI1,034 2014 TES Thermal 21 Soute den for depreciation wind.com odwill amount "A Balanced Formula for Growth by Andrew Coway, Chris O'Donnell, and Corey Honch Credit Sunne Fint Hoston quity Research, November 82001 it hp 5 6 7 CO 9 O 16/16 100% For the exclusive use of M. SANTA, 2021. -16- 1 UV0008 Exhibit 9 (continued) The cost of debt (used for both debt and leases) is the annual rate consistent with each firm's bond rating. The cost of equity may be estimated in a variety of ways-a usual practice is to use the capital-asset pricing model Ke-RB (R.-R) where: RI - Risk-free rate, typically the yield on 10-year US Treasury bonds B = Beta, a measure of the volatility of a company's stock price with respect to market movements Re-Ri - Market-risk premium, the additional return investors require over the risk- free rate to compensate them for investing in companies RI hp O 5 6 7 00 9 O 20 T Y U 1 O P G H K SUS PEPSL 2001 /Co2013%20Pepsipdf 15/16 100% Vand up alorrig leases, write-offs and cumulative losses, and accumulated goodwill amortization. The rationale for including losses and write-offs in continuing capital is that these represent unproductive assets, or failed investment. Were they excluded from the capital equation, the sum would only count successful efforts and not accurately reflect the performance of the firm. Accumulated goodwill amortization likewise needs to be included in invested capital because it represents a true investment. Excess cash not needed for operations, such as marketable securities, may be deducted from the invested capital base Cost of capital. The capital charge applied against NOPAT should be based on a blend of the costs of all the types of capital the firm employs or the weighted average cost of capital WACC-K(1-1) D/(D+E) + K EXD+E) where T K D E Cost of debt Effective marginal tax rate Cost of equity Total debt Total equity AM 0 RI hp . 8 7 o 9 6 4 5 00 2 P O 20 T Y U 20%20Pepsi.pdf 15 / 16 100% Exhibit 9 COKE VERSUS PEPSI, 2001 Some Guidelines for Estimating Components of EVA NOPAT. Net operating profit after taxes (NOPAT) is calculated with the aim of arriving at the actual cash generated by the concern. Adjustments might include adding back goodwill amortization and other noncash expenses. Taxes must similarly be adjusted to reflect only actual cash taxes. Depreciation is not added back to NOPAT despite being a noncash expense, because of the assumption that depreciation represents a true economic cost (.e., it is the amount that must be reinvested to maintain operations at the existing level). For consisteney, invested capital is measured net of depreciation lavested capital. Invested capital means, simply, the amount of capital invested in the business. It may be calculated either from the asset side or from the liabilities + equity side of the balance sheet. The latter is the simpler method. Invested capital includes debt, equity, and other near-capital items that represent economic value employed on behalf of the firm, such as the present value of operating leases, write-offs and cumulative losses, and accumulated goodwill amortization. The rationale for including losses and write-offs in continuing capital is that these represent unproductive assets, or failed investment. Were they excluded from the capital equation, the sum would only count successful efforts and not accurately reflect the performance of the firm Accumulated goodwill amortization likewise needs to be included in invested capital because it represents a true investment. Excess cash not needed for operations, such as marketable securities, may be deducted from the invested capital base. Cost of capital. The capital charge applied against NOPAT should be based on a blend of the costs of all the types of capital the firm employs, or the weighted average cost of capital WACC-k (1-1) D D+E+KENDE) . AI e hp $ 4. % 5 6 6 & 7 8 9 O
Step by Step Solution
There are 3 Steps involved in it

Get step-by-step solutions from verified subject matter experts