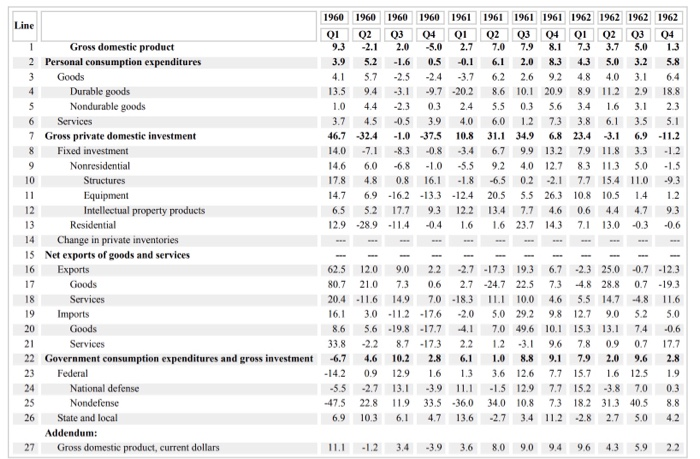
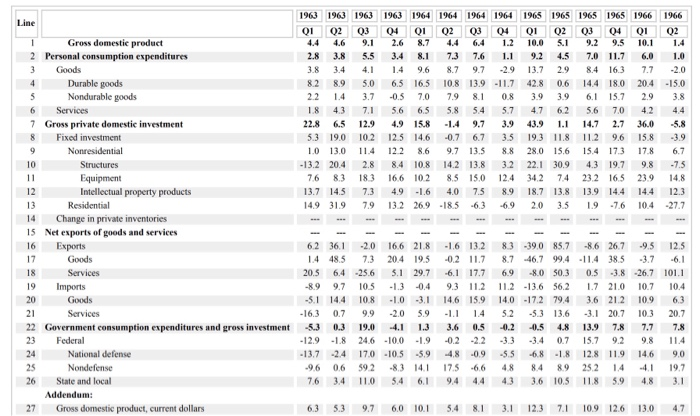
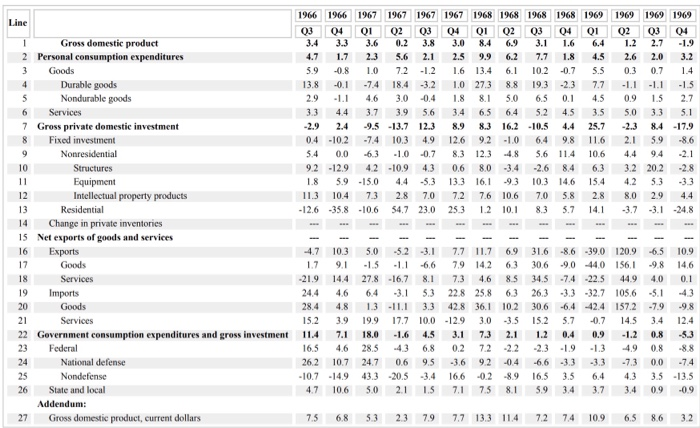
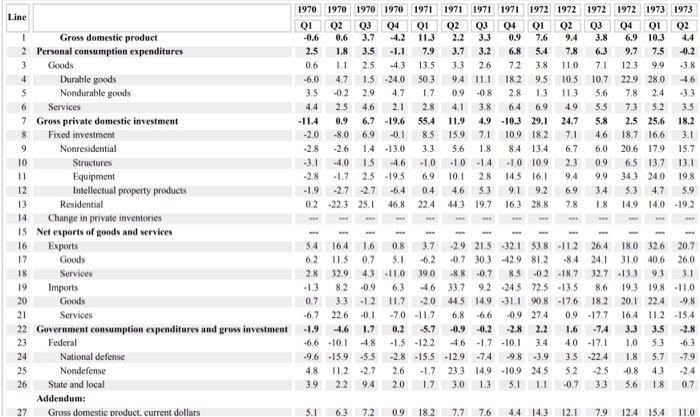
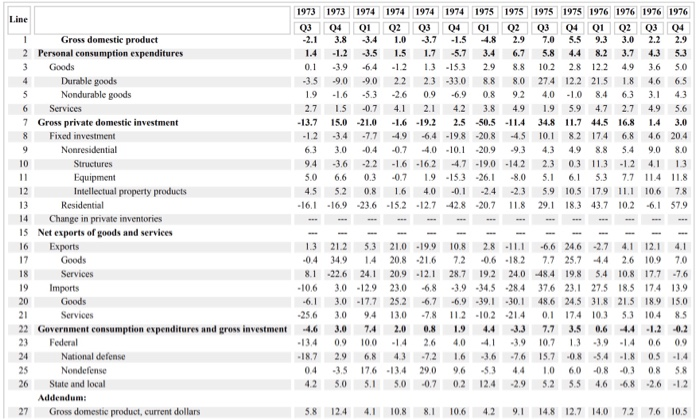
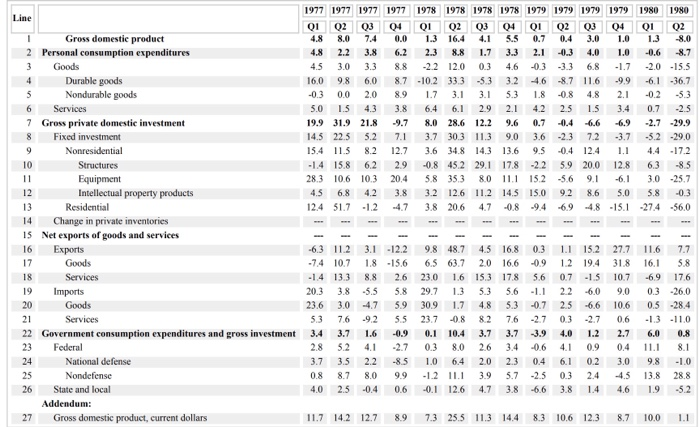
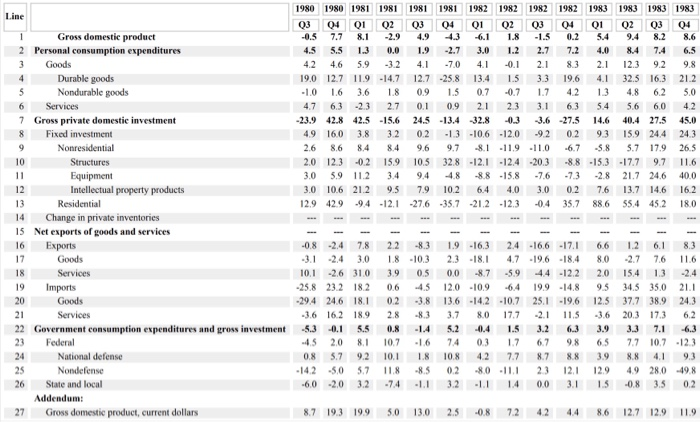
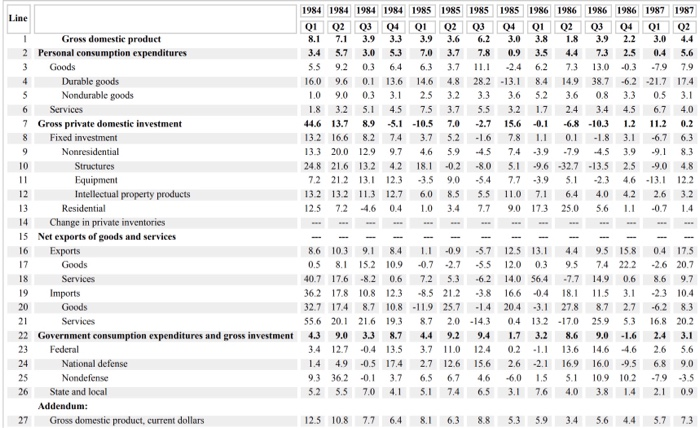
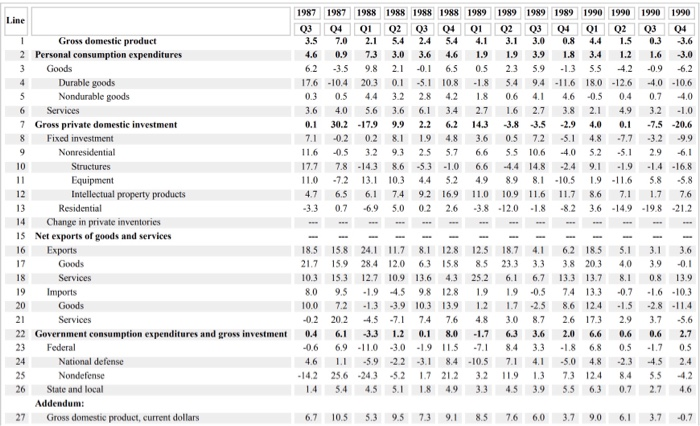
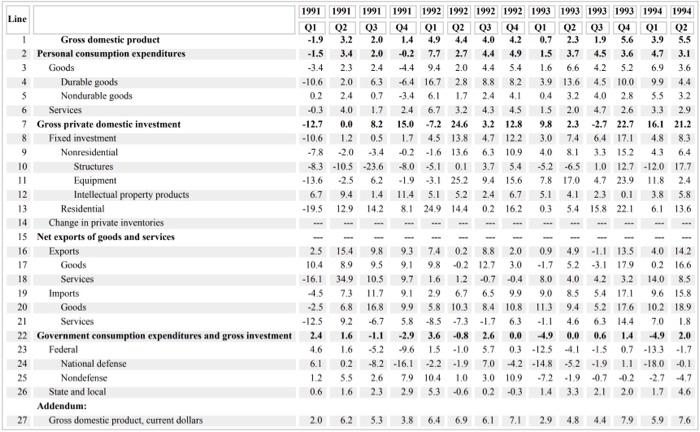
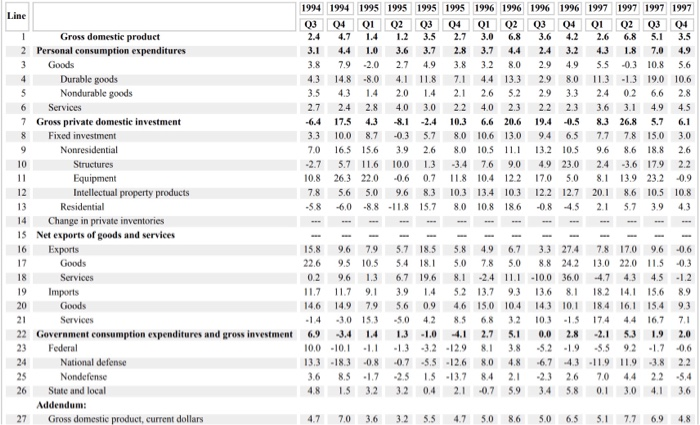
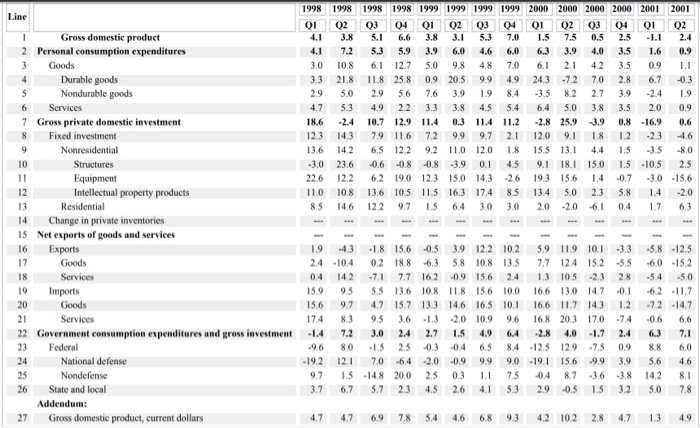
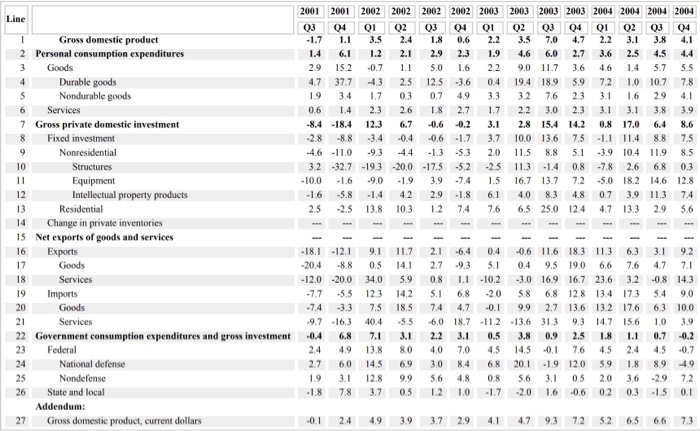
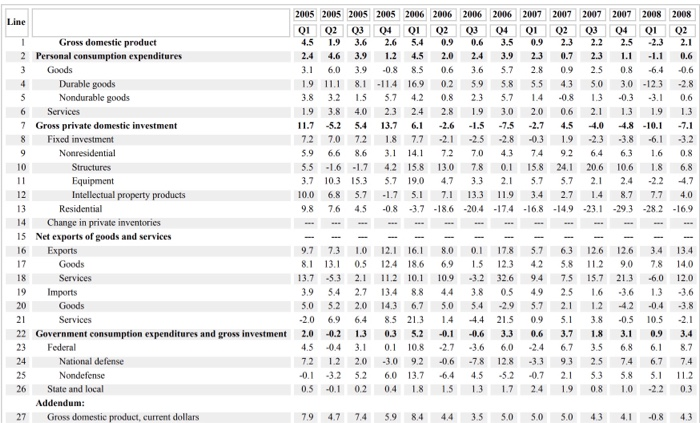
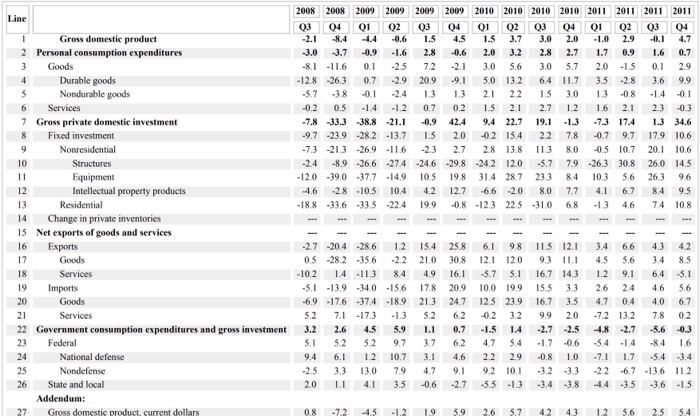
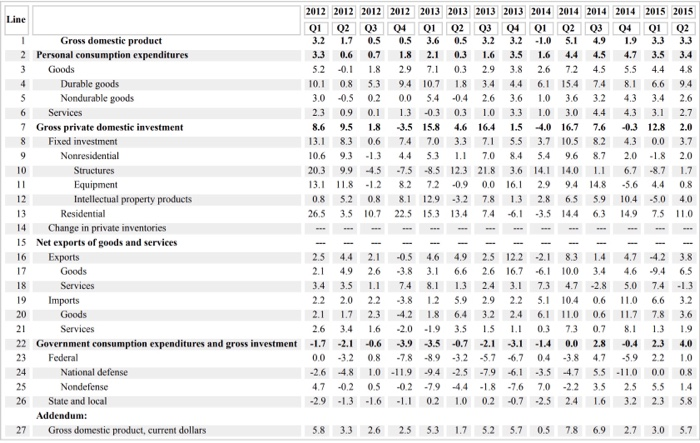
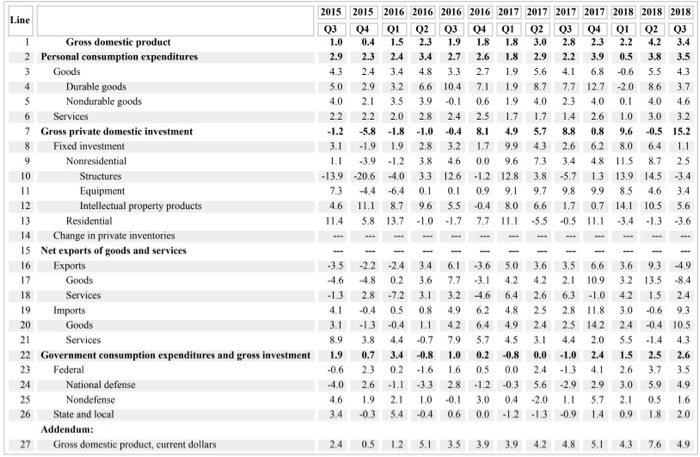
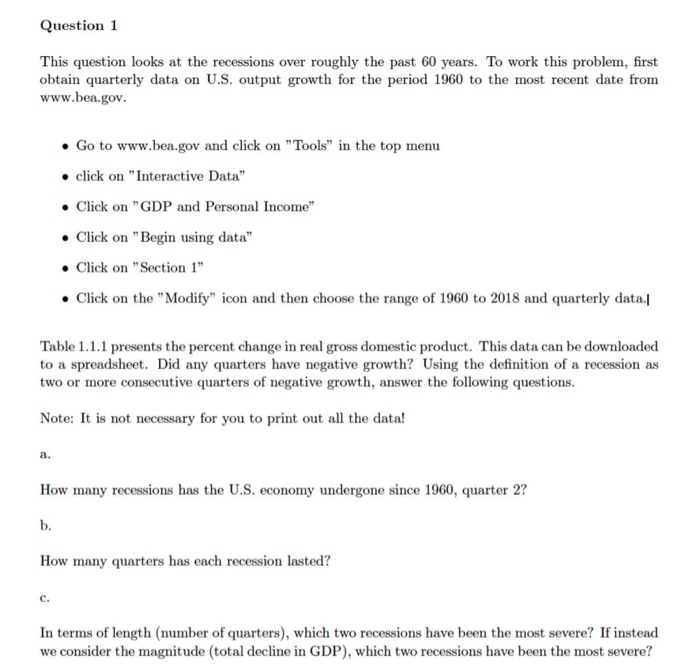
1960 1960 1960 1960 196 1961 1961 1961 1962 1962 1962 1962 Line O1 92 3 04 Q1 2 03 04 02 03 04 Gross domestic product 9.3 2.1 2.0 5.0 2.77.0 7.9 8. 73 3.7 5.0 13 3.9 5.2 1.6 0.5 . 6. 2.0 8.3 43 5.0 3.2 5.8 4.1 5.7 2.5 2.4 3.7 6.2 2.6 9.2 48 4.0 3. 64 3.5 9.4 -3.1 9.7 -20.2 8.6 10. 20.9 8.9 11.2 2.9 18.8 0 4.4 2.3 0.3 24 5.5 0.35.6 34 16 3.1 2.3 .7 4.5 -0.5 3.94.0 6.0 12 7.3 3.8 6.13.5 5.1 46.7 -32.4 1.0 -37.5 10.8 31. 34.9 6.8 23.4 3. 6.9 11.2 4.0 -7.1 -8.3 -0.8 3.46.7 9.9 13.2 79118 3.3 1.2 4.6 6.0 6.8 1.0 5.5 9.2 4.0 2.7 8.3 13 5.0 1.5 17.8 4.8 0.8 16. 18 -6.5 0.2 -2. 7.7 15.4 11.0 -9.3 4.7 6.9 162 -13.3 -12.4 20.5 5.5 26.3 10.8 10.5 14 12 6.5 5.2 17.7 9.3 12.2 134 7.7 4.6 0.6 4.4 4.7 9.3 12.9 -28.9 114 0.4 6 6 23.7 14.3 7. 13.0 -0.3 06 2 Personal consumption expenditures 3 Goods Durable goods Nondurable goods 6 Services 7 Gross private domestic investment 8 Fixed investment Equipment Intellectual property products 12 13 14 Change in private inventories 15 Net exports of goods and services 16 Exports Residential 62.5 12.0 9.0 2.2 -2.7 -173 19.3 6.7-2.3 25.0 -0.7-12.3 0.7 21.0 7.3 0.6 2.7 -24.7 22.5 7.3 -48 28.8 0.7-19.3 20.4 -11.6 14.9 7.0 -183 11.1 10.0 4.6 5.5 14.7 -4.811.6 16.1 3.0 112 -17.6 2.0 5.0 29.2 9.8 12.7 9.0 5.2 5.0 8.6 5.6 -19.8 -17.7 7.0 49.,6 10.1 15.3 13.1 74 0.6 33.8 2.2 8.7 -17.3 2.22 3. 9.6 78 0.9 0.7 17.7 22 Government consumption expenditures and gross investment 6.7 4.6 10.2 2.8 6. 1.0 8.8 9.1 7.9 2.0 9.6 2.8 -14.2 09 12.9 16 3 3.6 12.6 7.7 15.7 1.6 12.5 19 5.5 -2.7 13.1 -3.9 11.1 -1.5 12.9 7.7 15.2 -3.87.0 0.3 -47.5 22.8 119 33.5 -36.0 34.0 10.8 7.3 18.2 31.3 40.5 8.8 6.9 103 6,1 4.7 13.6 2.7 3.4 12 2.8 2.7 5.0 42 Goods Services 19 Imports 20 21 Goods Services 23 Federal National defense 26 State and local Addendum: 27 Gross domestic product, current dollars 12 3.4 -3.93.6 8.0 9.0 94 9.6 4.3 5.9 2.2 1963 1963 1963 1963 1964 1964 1964 1964 1965 1965 1965 1965 1966 1966 Line 01 02 03 04 1 02 03 4 01 2 03 04 1 2 44 4.6 9.1 2.6 8.7 4.464 .2 10.0 5 9.2 9.5 10 14 2.8 385.5 3.4 8. 7.3 7.6 1.1 9.2 4.5 7.0 11.7 6.0 1.0 3.8 34 4.1 14 9.6 8.7 9.7 -29 13.7 29 84 163 7.7-2.0 82 8.9 5.0 6.5 165 108 13.9 -11.7 428 0.6 144 180 20.4 -15.0 22 14 3.7 0.5 7.0 79 81 08 39 3.9 6.5.7 29 38 18 437.1 5.6 6.5 5.8 54 5.7 47 62 5.6 7.0 42 4.4 228 6.5 12.9 4.9 158 14 9.7 3.9 43.9 14.7 2.7 36.0 5.8 5.3 19.0 102 125 14.6 -0.7 6.7 3.5 19.3 11.8 12 9.6 15.8 3.9 10 13.0 114 122 8.6 9.7 13.5 88 28.0 5.6 154 173 178 67 -13.2 204 2.8 8.4 108 14.2 13.8 3.2 22.1 30.9 4.3 19.7 9.8 7.5 7.6 83 183 166 102 85 150 124 34.2 74 23.2 165 239 48 13.7 14.5 7.3 4.9 -1.6 4.0 75 8.9 18.7 13.8 13.9 14.4 144 12.3 49 319 79 132 269 -18.5 63 69 20 35 9 -7.6 104 27. Gross domestic product 2 Personal consumption expenditures 3 Goods e goo Nondurable goods 6 Services 7 Gross private domestic investment 8 Fixed investment Nonresidential Structures Equipment Intellectual property products Residential 14 Change in private inventories 15 Net exports of goods and services 6 Exports 62 36.1 20 66 218 6 132 83 -39.0 85.7 8.6 267 9.5 12.5 14 485 73 204 195 -02 11.7 8.7 46.7 994 -114 38.5 3.7 6. 20.5 6.4 -25.6 5.1 29.7 -6.1 17.7 6.9 8.0 50.3 05 3.8 -267 101.1 8.9 9.7 105 -1.3 0.4 9.3 11.2 112 -13.6 56.2 17 21.0 10.7 104 5.1 14.4 108 1.0 3. 14.6 15.9 14.0-17.2 79.4 36 212 10.9 6.3 16.3 0.7 992.0 5.9 4 52 -5.3 13.6 3.1 20.7 103 20.7 22 Government consumption expenditures and gross investment 53 .3 19.4.1 1.3 3.6 0.5 02 0.5 48 13.9 7.8 7.7 78 12.9 -18 24.6 -10.0 1.9 0.22.2 3.3 34 07 15.7 9.2 9.8 114 -13.7 24 17.0 10.5 5.9 48 -09 5.5 6.8 1.8128 119 14.6 9.0 96 06 592 8.3 14 175 -66 48 84 89 25.2 14 19.7 76 3.4 110 54 6 94 4.4 43 3.6 10.5 11859 4.8 3. 19 Imports 20 Goods 23 Federal 24 26 27 National defense Nondefense State and local Addendum: Gross domestic product, current dollars 6.3 5.3 9.7 6.0 10 5.4 8.13.1 12.3 71 109 12.6 13.0 4.7 1966 1966 1967 1967 1967 19671968 1968 1968 1968 1969 1969 1969 1969 Line 1 2 3 03 4 2 3 4 2 03 04 1 2 3 04 3.4 3.3 3.6 0.2 3.8 3.0 8.4 6.9 3.1 1.6 6.4 2 2.7 1.9 4.7 1.7 2.3 56 2.1 2.5 9.9 62 7.7 1.84.5 2.6 2.0 3.2 Gross domestic product Personal consumption expenditures Goods 9 -0.8 10 72 1.2 16 13.4 6.1 10.2 -0.7 5.5 0.37 14 13.8 -0.1 -7.4 18.4 -3.2 1.0 27.3 8.8 19.3 2.3 7.7 -.1 1.5 9 4.6 3.0 0418 8 50 65 0 4.5 0.9 15 2.7 3.3 4.4 3.7 3.9 5.6 34 6.5 6.4 5.2 4.5 3.5 5.0 3.3 5.1 -2.9 2.4 9.5-13.7 12.3 8.9 8.3 16.2 -10.5 4.4 25.7 2.3 84 -179 04 -10.2 74 10.3 49 126 92 -1.0 64 9.8 11.6 2.1 5.9 8.6 4 0.0 631.0 07 8.3 123 48 5.6 114 10.6 4494 2.1 92-12.9 42 -10.9 43 0.6 8.0 34 -2.6 8.4 6.3 3.2 20.2 2.8 18 5.9 15.0 4.45.3 3.3 6. 9.3 10.3 14.6 54 4.2 5.3 3.3 113 10.4 7.3 28 7.0 7.2 7.6 10.6 7.0 5.8 2.8 8.0 29 44 12.6 -35.8 -10.6 547 23.0 25.3 12 10 8.3 5.7 14. 3.7 3. 24.8 Durable goods 6 Services 7 Gross private domestic investment 8 Fixed investment Nonresidential Structures Equipment Intellectual property products Residential 14 15 16 Change in private inventories Net exports of goods and services 4.7 10.3 5.0 52 3. 7.7 11.7 6.9 31.6 -8.6 -39.0 120.9 -6.5 10.9 7 9.115 11 66 79 14.2 63 306 -90 440 156.1 98 14.6 21.9 144 27.8 -16.7 8. 7.3 4.6 85 345 7.4 -22.5 44.9 4.00.1 24.4 4.6 64 3.1 53 228 25.8 63 263 3.3 32.7 105.6 -5. 43 28.4 4.8 13 1. 3.3 42.8 36. 10.2 30.6 -6.4 42.4 157.2 -7.9 9.8 15.2 39 199 17.7 100 -129 3.0 35 15.2 5.7 0.7 14.5 34 12.4 22 Government consumption expenditures and gross investment 114 7.1 18.0 1.6 4.5 3.1 7.3 2. 1.2 0.4 0.9-1.2 08 5.3 65 4.6 28.5 43 6.8 0.2 72 -22 2.3 -1.9 -1.3 49 08 88 262 10.7 24.7 0.6 9.5 3.6 92 -04 66 3.3 3.3 -7.3 00 7.4 10.7 -149 43.3 -20.5 3.4 166 0.2 89 16.5 3.5 64 4.3 3.5 13.5 4.7 10.6 5.0 21 15 7.1 7.5 8.1 5.9 3.4 3.7 3.4 09 09 Exports Goods 19 Imports 20 Goods Services 23 Federal 24 26 27 National defense Nondefenso State and local Gross domestic product, current dollars 7.5 6.8 53 2.3 79 7.7 13.3 114 7.2 74 109 6.5 86 3.2 1970 1970 1970 1970 1971 1971 1971 1971 1972 1972 1972 1972 1973 1973 01 2 3 4 1 2 3 4 1 2 3 4 1 02 0.6 0.6 3.7 4.2 113 2.2 3.3 0.9 7.6 9.4 3.8 69 10.3 44 2.5 18 3.5 -1. 7.9 3.7 3.2 68 5.4 7.86.3 9.7 7.5 -0.2 0.6 1.1 2.543 13.5 3.326 72 38110 71 123 99 3.8 6.0 4.7 1.5-24.0 50.3 94 11.1 18.2 9.5 10.5 10.7 22.9 28.04.6 35 -02 2.9 4.7 1.709 08 28 13 11356 78 24 -33 44 25 4.6 2.1 28 4.1 3.8 64 6.9 4.9 5.5 7.3 5.2 3.5 11.4 0.9 6.7 -19.6 554 19 4.9 -10.3 29. 24.7 5.8 2.5 25.6 18.2 2.0 -8.0 6.9 01 8.515.9 7.1 10.9 18.2 7.1 4.6 18.7 16.63.1 2.8 -2.6 1.4 -13.0 3.3 5.6 18 8.4 134 6.7 6.0 206 179 15.7 3.1 -4.0 15 4.6 1.0 1.0 -14 10109 2.3 09 65 13.7 13.1 2.8 -1.7 2.5 -195 69 10. 28 14.5 16.1 9.499 343 24.0 198 1.9 -2.7 -2.7 6.4 04 4.6 5.3 9.1 9.2 6.9 3.4 5.3 4.7 5.9 0.2 -22.3 25 46.8 22.4 44.3 9.7 16.3 28.8 78 18 14.9 14.0 -19.2 Line I 2 3 Gross domestic product Personal consumption expenditures Goods Durable goods SNondurable goods 6 Services 7 Gross private domestic investment 8 Fixed investment Nonresidential Equipment Intellectual property products Residential 14 15 6 Change in private inventories Net exports of goods and services Exports 54 16.4 16 08 3.7 2.9 21.5 -32.1 53.8112 264 180 32.6 20.7 6.2 115 0.751 6.2 07 30.3 42.9 81.284 241 310 40.6 26.0 28 32.9 4.3 110 39.0 88 0.7 85 0.2 18.7 327 -133 933. 13 8.2 09 63 .6 33.792 24.5 72.513.5 8.6 193 19.8 11.0 0.7 3.3 1.2 17 -2.0 44.5 14.9 -31.1 908 17.6 18.2 20. 22.4 9.8 6.7 22.6 0.1 7.0 -117 6.8 66 09 274 0.9 17.7 164 112 15.4 22 Government consumption expenditures and gross investment 19 4.6 1.7 .2 5.7 0.9 0.2 -2.8 2.2 16 7.4 3.3 3.5 2.8 -6.6.10.1-4.8-1.5-12.2-46-1.7.10.1 3.4 4.0-17.1 1.0 5.3-63 9.6-15.9 5.5 -2.8 -15.5 -12.9 7.4 98 -39 3.5 -22.4 18 5.7 -7.9 8 112 27 26 -17 23.3 14.9 109 245 52 2.5 08 43 -24 3.9 2.2 9420 .7 3.0 13 5.1 1.1 -0.73.3 5.6 18 0. Goods 19 Imports 20 Goods 2 Services 23 Federal 24 National defense Nondefense State and local 26 Addendum: 27 Gross domestic product. current dollars 5.1 6.3 7.2 0.9 18.2 7.776 4.4 14.312.1 7.9 12.4 15.4 11.0 1973 1973 1974 1974 1974 1974 1975 1975 1975 1975 1976 1976 1976 1976 03 04 2 3 04 1 2 3 94 1 2 3 04 -2.1 3.8 34 1.0 3.7 1.5 4.8 2.9 7.0 55 9.3 3.0 2.2 2.9 1.4 1.2 3.5 1.5 1.7 5.7 3.4 6.7 5.8 44 8.2 3.7 4.3 53 01 3.9 -64-12 13 -153 29 8.8 102 28 122 49 3.6 5.0 3.5 -9.0 90 22 23 -33.0 88 8027.4 12.2 215 18 4.6 65 9 -1.6 5.3 2.6 0.9 -6.908 92 4.0 10 84 63 3. 43 2.7 15 -0.7 4.1 2. 4.2 3.8 4.9 19 5.9 4.7 2.7 4.9 5.6 -13.7 15.0 21.0 1.6 -19.2 2.5 50.5 -114 34.8 11.7 44.5 16.8 14 3.0 12 -34 7.7 49 -64 -19.8-20.8 4510 8.2 174 68 4.6 20.4 6.3 3.0 0.7 4.0 -10. -20.9 9.3 4.3 4.9 88 54 9.0 8.0 94 3.6 -22 6 62 4.7 -19.0 142 2.3 03 3 -12 4. 13 5.0 6.6 03 0.7 19 -15.3 -26 8.0 5. 6. 5.3 7.7 114 11.8 45 5.2 0.8 16 40 -0. -24 -2.3 5.9 10.5 179 1 106 78 16.1 -169 -23.6 -15.2 12.7 -428 -20.7 118 29.1 18.3 43.7 10.2 6.1 57.9 Gross domestic product Personal consumption expenditures 2 Durable goods Nondurable goods Gross private domestic investment 8 7 Fixed investment Nonresidential Equipment Intellectual property products Residential 14 Change in private inventories 15 Net exports of goods and services 16 Exports 3 21.2 53 21.0 -199 108 28 11 -6.6 24.6 2.7 4.1 12.1 4.1 04 34.9 14 20.8 216 7.20.6 182 7.7 25.7 44 2.6 109 70 8.1 -22.6 24.1 20.9 -121 28.7 19.2 24.0 48.4 19,8 5.4 10.817.7 -7.6 10.6 30 -129 230 6.8 3.9-34.5 284 376 23,1 27.5 18.5 174 13.9 6.1 3.0 17.7 25.2 6.7 -6.9 -39.1 -30.1 48.6 24.5 31.8 21.5 18.9 15.0 25.6 3.0 94 13.0 78 112 102 -214 0. 174 10.3 53 104 85 22 Government consumption expenditures and gross investment4.6 3.0 74 2.0 0.8 19 4.4 3.3 7.7 3.5 0.6 4.4 1.2 -0.2 13.4 09 100 -14 26 4041 39 07 13 39 14 06 09 18.7 2.9 6.843 7.2 16 3.6 7.6 15.7 08 54 1.8 0.5 1.4 04 3.5 17.6 -13,4 29.0 96 5.3 4.4 10 60 08 03 08 5.8 4.2 5.0 5.1 50 0.7 0.2 124 -29 5.2 5.5 4.6 -6.8 2.6 -1.2 Goods 18 Services 19 Imports Services 23 Federal National defense Nondefense State and local 26 Addendum 27 Gross domestic product, current dollars 5.8 124 4.1108 8.1 106 429.1 148 12.714.0 72 7.610.5 977 1977 1977 1977 1978 1978 1978 1978 1979 1979 1979 1979 1980 1980 01 2 93 04 2 3 4 02 3 4 02 4.8 8.0 7.4 0.0 3 164 . .5 0.7 0.4 3.0 .0 3 8.0 4.8 2.2 3.8 6.2 2.3 88 1.7 3.3 2.1 03 4.0 1.0 0.6 8.7 4.5 3.0 3.3 8.8 22 12.0 03 46 0.3 3.3 6.8 1.7 -2.0 15. 16.0 9.8 6.0 8.7 -10.2 33.3 5.3 3.2 4.6 8.7 16 9.9 -6.1 36.7 0.3 0.0 2.0 89 1.7 3. 3.1 5.3 18 -08 48 2 -0.2 53 5.0 1.5 4.3 3.8 6.4 6.1 29 21 4.2 25 5 3.4 0.7 -2.5 19.9 31.9 21.89.7 8.0 28.6 12.2 9.6 0.7 -0.4 6.6 6.9 -2.7 -29.9 14.5 22.5 5.2 7.1 3.7 30.3 3 9.0 3.6 -23 7.2 3.7 5.2 -29.0 15.4 115 8.2 2.7 3.6 34.8 14.3 13.6 9.5 04 124 4.417.2 14 15.8 6.2 2.9 -08 45.2 29. 17.8 -22 59 20.0 128 6.3 8.5 28.3 10.6 10.3 204 5.8 35.3 8.0 1 15.2 -5.6 9. 6 3.0 25.7 4.5 6.8 4.2 3.8 3.2 126 11.2 14.5 15.0 9.2 8.6 5.0 5.8 0.3 24 51.712 4.7 38 206 4.7 08 94 6.9 48 15. -274 -56.0 Gross domestic product Personal consumption expenditures 2 Goods Durable goods Nondurable goods 6 Services 7 Gross private domestic investment 8 Fixed investment Nonresidential Structures Intellectual property products Residential 14 15 Change in private inventories Net exports of goods and services -6.3 2 3.1 -12.2 9.8 48.7 4.5 168 0.3 1.1 15.2 27.7 11.6 7.7 74 10.7 18 15.6 6.5 63.7 20 166 -09 1.2 194 318 161 5.8 14 13.3 88 26 23.0 16 15.3 178 5.6 07 -1510.7 -69 17.6 20.3 38 5.5 5.8 29.7 13 5.3 5.6 22 -6.0 9.0 0.3 -26.0 23.6 3.04.7 5.9 309 1.7 48 53 -0.7 25 -6.6 10.6 0.5 -28.4 5.3 7.6 9.2 5.5 23.7 08 82 76 2.7 0.3 2.7 0.6 13 11.0 Goods 18Services 19 Imports Goods Services 22 Government consumption expenditures and gross investment 3.4 3.7 16 -0.9 0. 10.4 3.7 3.7 -3.9 4.0 1.2 2.7 6.0 0.8 23 Federal 24 National defense 28 5.2 4.1 -2.7 0.3 8.0 26 34 06 4.1 0.904 11 8. 3.7 3.5 22 -8.5 10 64 20 2.3 0.4 61 0.2 3.0 9.8 -1.0 0.8 8.7 8.0 9.9 1.2 3.9 5.7 2.5 0.3 24 4.5 13.8 28.8 .0 2.5 0.4 0.6 -0.1 12.6 4.7 3.8 -6.63.8 1.4 4.6 1.9-5.2 26 State and local Addendum: 27 Gross domestic product, current dollars 17 4.2 12.7 8.9 7.3 25.5 3 14.4 8.3 10.6 12.3 8.7 10.0 1.1 1980 1980 1981 1981 1981 1981 1982 1982 1982 1982 1983 1983 1983 1983 03 04 2 Q3 4 2 03 4 2 3 04 0.5 7.7 81 2.9 4.9 43 6.1 1.8 1.5 0.2 54 9.4 8.2 8.6 4.5 5.5 13 0.0 1.9 -2.7 3.0 1.2 2.7 7.2 4.0 84 74 6.5 42 4.659 3.2 470 4 21 83 2 23 9.29.8 19.0 12.7 119 -14.7 12.7-25.8 13.4 5 3.3 19.6 4.1 32.5 16.3 21.2 1.0 1.6 36 18 095 0.7 -07 17 4.2 3 4.8 62 50 47 6.3 2.3 2.7 0.1 0.9 2.1 2.3 3.1 63 54 5.6 6.0 4.2 239 42.8 42.5 15.6 24.5 13.4 32.8 03 3.6 -27.5 14.6 40.4 27.5 450 49 16.0 38 32 0.2 13 -10.6 -12.0 9.2 0.2 9.3 15.9 24.4 243 26 8.6 84 84 96 97 81 -11.9 -110 6.7 8 5.7 17.9 265 2.0 123 -02 159 10.5 32.8 -12.1 -12.4 -20.3 88 -15.3 -17.7 9.711.6 3.0 5.9 112 34 94 48 8.8 15.8 7.6 73 28 21.7 24.6 40.0 3.0 106 21.2 95 7.9 10.2 64 4.0 3.0 0.2 7.6 13.7 14.6 16.2 129 42.9 94 12 27.6 -35.7-21.2 12.3 -04 35.7 88.6 55.4 45.2 18.0 Gross domestie product Personal consumption expenditures 2 Goods Durable goods Nondurable goods 5 7 Gross private domestic investment 8 Fixed investment Nonresidential Structures Equipment Intellectual property products Residential 14 Change in private inventories 15 Net exports of goods and services 16 Exports Goods Services -08 -2.47.8 2.2 8.3 19 -16.3 2.4 -166 -17.1 6.6 2 6.1 8.3 3.1 -2.4 30 18 10.3 2.3 -18 4.7 -19.6 184 8.0 2.7 7.6 11.6 10 26 310 39 0.5 0.0 8.7 -5944 12.2 20 154 13 2.4 19 Imports 20 Goods -25.8 23.2 18.2 0.6 4.5 12.0-109 64 199 -14.8 95 345 35.0 21. 294 24.6 18 0.2 38 13.6-14.2 -10.725.1-19.6 12.5 37.7 38.9 24.3 3.6 16.2 189 28 8.3 3.7 8.0 7.7 -2. 11.5 -3.6 20.3 17.3 6.2 22 Government consumption expenditures and gross investment 5.3 0.1 5.5 0.81.4 52 0.4 1.5 3.2 63 3.9 3.3 7. 6.3 4.5 2.0 8 10.7 16 7403 17 6.7 9865 7.7 10.7 12.3 0.8 5.7 9.2 10.1 18 108 4.2 7.7 8.7 8.8 3.9 8.8 4. 9.3 14.2 -5.0 5.7118 8.5 02 8011.1 23 12. 29 49 28.0 -49.8 6.0 -2.0 3.2 7.41 3.2 1.1 14 00 3. 15 -0.8 3.50.2 Services 3 Federal National defense Nondefense 26 State and local Addendum: 27 Gross domestic product, current dollars 8.7 19.3 199 50 13.0 2.5 0.8 7.242 4.4 8.6 12.7 29 11.9 1984 1984 1984 1984 1985 1985 1985 1985 1986 1986 1986 1986 1987 1987 01 23 4 1 Q2 Q3 04 Q1 92 3 4 Q1 Q2 8.1 7. 3.9 3.3 3.9 3.6 62 3.0 3.8 18 3.9 2.2 3.0 4.4 3.4 5.7 3.0 53 7.0 3.7 7.8 0.9 3.5 4.4 7.3 2.5 0.4 5.6 5 9.2 03 64 63 3.7 24 62 73 13.0 03 79 7.9 16.0 9.6 0.1 13.6 14.6 4.8 28.2 -13.1 8.4 14.9 38.7 -6.2 -21.7 17.4 10 9.003 3. 2.5 3.2 3.3 36 5.2 36 08 3.3 0.5 3. 1.8 3.2 5.1 4.5 7.5 3.7 5.5 3.2 1.7 24 3.4 4.5 6.7 4.0 44.6 13.7 8.9 5.1 10.5 7.0 2.7 15.6 0.1 -68 10.3 1.2 12 0.2 3.2 16.6 8.2 74 3.7 5.2 1.6 7.8 1 0 1.8 3.1 -6.7 6.3 13.3 20.0 29 9.7 4.6 5.9 45 7.4 3.9 7.9 4.5 3.9 9.1 8.3 24.8 21.6 13.2 42 18.1 -0.2 8.0 5.1 9.6 -32.713.5 2.5 9.0 4.8 7.2 212 13.1 12.3 3.5 9,0 54 7.7 -3.9 5 2.3 4,6 -13. 122 13.2 13.2 3 12.7 6.0 8.5 5.5 110 7.1 6.4 4.0 42 26 3.2 125 7.2 4.6 04 10 34 77 9.0 173 25.0 5.6 110.7 1 Gross domestie product Personal consumption expenditures 2 Durable goods 5 6 7 Nondurable goods Services Gross private domestic investment 8 Fixed investment Nonresidential Structures Equipment Intellectual property products Residential Change in private inventories 14 15 16 Net exports of goods and services 8.6 10.3 9.1 8.4 1 09 5.7 125 13.1 4.4 9.5 15.8 04 17.5 0.5 8.1 15.2 10.9 -0.7 2.7 5.5 12.0 03 9.5 7.4 222 -26 20.7 40.7 17.6 -8.2 0.6 7.25.3 62 14.0 56.4 7.7 14.9 0.6 8.69.7 36.2 178 108 12.3 8.5 21.2 38 166 04 18.1 5 3.1 23 10.4 32.7 17.4 8.7 108 -11.9 25.7 14 20.4 3.1 278 8.7 2.7 -62 8.3 55.6 20 21.6 19.3 8.7 2.0 14.3 04 13.2-17.0 259 5.3 168 20.2 22 Government consumption expenditures and gross investment 4.3 9.0 3.3 8.7 4.4 9.2 9.4 1.7 3.2 8.6 9.01.6 24 3.1 .4 12.7 0.4 13.5 3.71.0 12.4 0.2 1.1 13.6 14.6 4.6 26 5.6 14 4.9 -0.5 17.4 2.7 12.6 15.6 2.6 -2.1 16.9 16.0 9.5 6.8 9.0 9.3 362 -0.1 3.7 6.5 67 4.6 6.0 1.5 5 109 102 -79 3.5 5.2 5.5 7.0 4. 5.1 7.4 65 3.1 7.6 4.0 3.8 1.4 2.1 0.9 Exports Goods 19 Imports National defense Nondefense 26 State and local 27 Gross domestic product, current dollars 12.5 10.8 7.7 64 8 63 8.8 5.3 5.9 3.4 5.6 4.4 5.7 7.3 1991 1991 1991 1991 1992 1992 1992 1992 1993 993 1993 1993 1994 1994 01 2 03 04 2 3 04 1 2 3 4 1 02 -1.9 3.2 2.0 14 4.9 .4 4.0 4.2 0.7 2.3 .9 56 3.9 55 1.5 3.4 2.0 -0.2 7. 2.7 4.4 4.9 15 3.7 4.5 3.6 4.7 3.1 34 23 24 44 94 2.0 44 5.4 16 66 42 5.2 69 3.6 -10.6 2.0 63 64 6.7 28 88 8.2 3.9 13.6 4.5 10.0 99 4.4 0.2 2.4 0.73.4 6. 1.724 4.1 043.2 4.0 28 5.5 3.2 0.3 4.0 7 24 6.7 3.2 4.3 45 5 2.0 4.7 2.6 3.3 2.9 12.7 0.0 8.2 15.0 -7.2 24.6 3.2 12.8 9.8 23 2.7 22.7 6 21.2 -10.6 1.2 05 7 4.5 13.8 4.7 122 3.0 74 64 17.1 488.3 78 -2.0 34 02 1.6 136 63 109 40 813.3 152 4.3 6.4 8.3 -10.5 -23.6 8.0 5. 0.1 3.7 5.4 5.2 65 1.0 12.7 -12.0 17.7 13.6 -2.5 6.2 1.9 3.1 25.2 94 156 7.8 17.0 4.7 23.9 118 2.4 6.7 9.4 14 4 5.1 5.2 2.4 6.7 5.1 4 2.3 0.1 3.8 5.8 19.5 12.9 14.2 8 24.9 144 0.2 162 0.3 54 158 22.1 6. 13.6 Gross domestic product Personal consumption expenditures 2 Goods Durable goods Nondurable goods Services 6 7 Gross private domestie investment 8 Fixed investment Nonresidential Structures Equipment Intellectual property products Residential Change in private inventories 14 15 16 Net exports of goods and services 25 15.4 9.8 9.3 7.4 0.2 88 20 0.9 49 1.1 13.5 40 14.2 04 89 95 91 98 -02 12.7 30 -17 52 3.1 179 0.2 166 -16.1 34.9 105 9.7 16 1.2 -0.7 0.4 8.0 4.0 42 3.2 14.0 8.5 4.5 7.3 7 9.1 296.7 65 99 90 8554 17.1 96 15.8 2.5 68 16.8 9.9 5.8 103 8.4 108 13 94 5.2 17.6 102 18.9 12.5 9.2 -6.7 5.8 -8.5 -7.3 17 6.3 4.6 6.3 14.4 70 18 22 Government consumption expenditures and gross investment 2.4 1.6 -1.1 -2.9 3.6 -0.8 2.6 0.0 4.9 0.0 0.6 14 4.9 2.0 .6 1.6 5.2 9.6 15 -1.0 5.7 0.3 -12.5 4 15 0.7 -13.3 1.7 6.1 0.2 -8.2 -16. 2.219 7.0 4.2 14.8 52 -1.9 1.1 -18.0 -0.1 2 55 26 79 104 10 3.0 109 7219 0.7 -02 -2.7 4.7 Exports 19 Imports Services 24 26 27 National defense Nondefense State and local Addendum: Gross domestic product, current dollars 2.0 62 5.3 3.8 64 69 6.1 7.1 29 48 4.4 7.9 5.9 7.6 1994 1994 1995 1995 1995 1995 1996 1996 1996 1996 1997 1997 1997 1997 Line 03 4 2 3 04 2 3 04 2 03 04 4.3 14.8 8.0 4.1 118 7.1 4.4 13.3 29 8.0 11.3 1.3 19.0 10.6 .5 4.3 4 2.0 14 2.1 26 5.2 29 3.3 24 02 6.6 2.8 3.3 10.0 8.70.3 5.7 8.0 10.6 13.0 94 6.5 7.7 78 15.0 3.0 7.0 16.5 15.6 3.9 2.6 8.0 10.5 13.2 105 9.68.6 18.8 2.6 2.7 5.7 11.610.0 13 3.4 7.6 9.0 49 23.0 2.4 -3.6 17.9 2.2 10.8 26.3 22.0 06 0.7 118 10.4 122 17.0 5.0 8 13.9 23.2 09 78 5.6 5.0 9.6 8.3 10.3 13.4 10.3 12.2 12.7 20.1 8.6 10.510.8 58 -60 -88 118 157 8.0 108 186 0.8 4.5 2.15.7 3.9 4.3 Intellectual property products inventories 15 Net exports of goods and services 15.8 9.6 7.95.7 18.5 5.8 4.9 6.7 3.3 274 78 17.0 96 -0.6 22.6 9.5 10.5 54 18 5.0 78 5.0 88 24.2 13.0 22.0 11.5 0.3 02 9.6 1.3 6.7 19.6 8.1 -24 11.1 -10.0 36.0 4.7 43 4.5 -1.2 117 11.7 9.13.9 4 52 13.7 9.3 3.6 81 18.2 4. 15,6 8.9 4.6 149 7.9 56 0.9 4.6 15.0 104 14.3 10.1 18.4 16.1 154 9.3 14 -3.0 15.3 5.0 4.2 85 68 3.2 10.3 15 174 44 16.7 7.1 22 Government consumption expenditures and gross investment6.9 3.4 14 1.31.0 4.1 2.7 5.1 0.0 2.82.1 53 1.9 2.0 0,0 10.1 13-3.2 12.9 8 385.2 19 -5.5 92 -1.7 06 3.3 -18.3 -0.8 0.7 -5.5 -12.6 8.0 4.8 -6.7 -43-119 11.9 3.8 2.2 3.6 8.5 1.7 -2.5 15 -13.7 84 2.1 23 2.6 70 44 2.2 -5,4 4.8 1.5 3.2 3.2 0,4 2.1 0.7 5.9 3.4 58 0. 3.0 4.1 3.6 Addendum: 27 Gross domestic product, current dollars SI 8 8 1.8 3 2 43 5 4 7 3 26 3 83 69 77 3.5 2A 2 2 9A 5.0 8 4 0 2 M6 86 3 2 2 3 2 3.5 0668 2 3.5 2 4-hi 3. QI 1.4 43 56 70 47 44 9 4 1 1998 1998 1998 1998 1999 1999 1999 1999 2000 2000 2000 2000 2001 2001 Line 01 2 03 04 Q 2 03 04 Q1 02 03 4 Q1 Q2 4.1 38 51 6.6 3.8 3.1 5.3 7.0 1.5 7.5 0.5 2.5 2.4 4.1 7.2 5.3 5.9 3.9 6.0 4.6 6.0 63 3.9 4.0 3.5 1.6 0.9 3.0 10.8 6.1 12.7 5.0 98 4.8 7.0 61 2.1 4.2 3.5 09 1 3.3 21.8 118 25.8 0.9 20.5 99 49 24.3 7.2 7.0 28 6.7 -0.3 29 5.0 29 5.6 7.6 3.9 19 84 3.5 82 2.73.9 24 1.9 4.7 5.3 4.92.2 3.3 3.8 45 5.4 64 5.0 38 3520 0.9 18.6 2.4 10.7 12.9 11.4 0.3 11.4 11.2 2.8 25.9 3.9 0.8 -16.9 0.6 123 14.3 7.9 116 72 9.9 9.7 2.1 120 9. 181.2 23 4.6 3.6 14.2 65 122 92 11.0 12.0 18 155 13.1 4.4 15 3.5 8.0 -3.0 23.6 0.6 -08 0.8 3.9 0. 4.5 9.1 18.1 150 15 -10.5 2.5 22.6 12.2 6.2 190 123 15.0 14.3 -2.6 19.3 15.6 14 0.7 3.0 15.6 11.0 108 13.6 105 5 16.3 17.4 85 13.4 5.02.3 5.8 14 2.0 8.5 14.6 122 9.7 15 64 3.0 3.0 2.0 -2.0 6 0.4 7 63 Gross domestic product Personal consumption expenditures 2 Goods Durable goods Nondurable goods 5 6 Services Gross private domestie investment 7 8 Fixed investment Nonresidential Structures Equipment Intellectual property products Residential Change in private inventories 14 15 16 Net exports of goods and services Exports 19 4.31.8 15.6 0.5 3.9 12.2 10.2 5.9 119 10. 3.3 5.812.5 24 10.4 02 18.8 63 58 10.8 13.5 7.7 124 15.2 -55 6.0 15.2 0.4 14.2 -7.1 7.7 16.209 15.6 24 1,3 105-23 28 54 -5.0 5.9 9.5 5.5 13.6 108 18 15.6 100 66 13.0 14.7 62 11.7 15.6 9.7 4.7 15.7 13.314.6 16.5 10.1 166 117 14.3 1.2 7.2 -14.7 17.4 83 95 3.6 1.3 2.0 10.9 9.6 168 203 170 4 06 6.6 Goods 18Services 19 Imports 20 Goods Services 22 Government consumption expenditures and gross investment14 7.2 3.0 2.4 2.7 1.5 4.9 64 -2.8 4.0 1.7 2.43 7. 23 Federal 24 National defense 25 26 State and local 9.6 8.0 1.5 2.5 03 04 65 84-12.5 12.9 -7.5 09 88 6.0 19.2 12.1 7.0 -64 -2.0 -0.9 99 9.0 -19.1 15.6 9.9 3.9 5.6 4.6 Nondefense 9.7 15 -148 200 25 03 75 04 8.7 -3.6 38 14.2 8. 3.7 6.7 5.7 2.3 45 2.6 4.1 53 2.9 0.5 1.5 3.2 5.0 7.8 Addendum: 27 Gross domestic product, current dollars 47 4.7 69 78 5.4 4.6 68 93 4.2 02 28 4.713 4.9 2001 2001 2002 2002 2002 2002 2003 2003 2003 2003 2004 2004 2004 2004 03 4 1 2 03 4 2 3 4 01 2 03 04 1.7 1.1 3.5 2.4 18 0.6 2.2 3.5 7.0 4.7 2.2 3.1 3.8 4.1 14 61 1.2 2. 29 2.3 1.9 4.6 6.0 2.7 3.6 2.5 4.5 4.4 29 15.2 0.7 50 6 22 9.0 11.7 3.6 46 1.4 5.7 5.5 4.7 37.7 4.3 2.5 12.5 3.6 0.4 194 18.9 5.9 7.2 1.0 10.7 7.8 9 34 17 03 07 493.3 3.2 76 23 3.1 1.6 29 4 0.6 14 2.3 26 1.8 2.7 1.7 2.23.0 2.3 3.1 3.1 3.8 3.9 8.4 -18.4 12.36.7 0.6 0.2 3.1 2.8 154 14.2 0,8 17.0 6.4 8.6 28 -8.8 34 0.4 0.6 -1.7 3.7 10.0 13.6 7.5 1.1 114 88 7.5 4.6-11.0 9.3 441.3 5.3 2.0 15 8.8 5.1 3.9 10.4 119 8.5 3.2 -32.719.3 -20.017.5 5.2 -25 131.4 0.8 -7.8 2.6 6.8 0.3 10.0 1.6 -9.0 9 3.9 74 15 16.7 13.7 7.2 5.0 18.2 14.6 12.8 6 -5.8 1.4 42 29 1.8 6 4.08.3 4.8 0.7 3.9 11.3 7.4 25 -2.5 138 10.3 12 74 7.6 6.5 250 124 4.7 13.3 29 5.6 Line Gross domestie product 2 Personal consumption expenditures 3 Goods 4 Durable goods Nondurable goods 6 Services 7 Gross private domestic investment 8 Fixed investment Nonresidential Structures Equipment Intellectual property products Residential 14 Change in private inventories 15 Net exports of goods and services 6 Exports 18. -12.1 9.1 11.7 2.1 -6.4 0.4 0.6 116 18.3 13 63 3. 9.2 20.4 -88 0.5 2.7 9.3 51 04 9.5 190 66 7.6477 12.0 -20.0 34.0 5.9 08 1.1 10.2 3.0 169 16.7 23.6 3.2 -08 14.3 7.7 -5.5 12.3 14.2 5.1 68 2.0 5.8 68 128 13.4 17.3 54 9.0 74 -3.3 7.5 18.5 7.4 4.7 0 9.92.7 13.6 13.2 17.6 63 10.0 9.7 -16.3 40.4 55 6.0 18.7 -11.2 -13.6 313 9.3 14.7 15.6 10 3.9 04 6.8 7.1 3. 2.2 3. 24 49 138 80 4070 45 14.50.1 76 45 24 45 -0.7 27 6.0 145 69 30 84 68 20 19 12.0 59 18 89 -4.9 9 3.1128 99 5.648 08 56 3.1 05 20 3.6 -2.9 7.2 18 7.8 3.705 1.2 1.0 1.7 -2.0 1.6 0.6 0.2 0.3 15 0.1 Goods 18 Services 19 Imports 20 Goods Services 22 23 24 Government consumption expenditures and gross investment 0.5 3.8 0.9 2.5 1.8 1.1 0.7 -0.2 Federal National defense Nondefense 26 State and local Addendum: 27 Gross domestic product, current dollars 0.1 2.4 4.9 3.9 3.7 2.9 4.1 4.7 9.3 7.2 5.2 65 66 7.3 2005 2005 2005 2005 2006 2006 2006 2006 2007 2007 2007 2007 2008 2008 01 02 03 04 1 2 3 94 Q1 2 93 04 1 2 .5 1.9 3.6 2.6 54 0.9 0.6 3.5 0.9 23 2.2 2.5 2.3 2.1 2.4 4.63.9 1.2 4.5 2.0 2.4 3.9 23 . 2.3 1.1 1.1 0.6 .1 6.0 3.9 -08 85 0.6 3.6 5.7 28 09 25 0.8 64 0.6 19 11.18.1 114 169 0.2 5.9 5.8 55 43 5.0 3.0 123 -2.8 3.8 3.2 15 5.7 4.20.8 2.3 5.714 08 13 -0.33. 0.6 1.9 384.0 2.3 24 28 19 3.0 2.0 0.6 2.1 1.3 19 1.3 7 5.2 54 13.7 6 . 1.5 7.5 2.7 4.5 4.0 4.8 10. -7.1 7.2 7.0 7.2 18 7.7 -2.1 -2.5 28 03 19 2.3 3.8 6.1 3.2 5.9 66 8.6 3.1 14. 7.2 7.0 43 74 9.264 63 16 0.8 5.5 1.6 1.7 4.2 15.8 13.0 78 0. 15.8 24. 20.6 10.6 18 6.8 .7 10.3 15.3 5.7 19.0 47 3.3 2 5.7 5.7 2 24 22 4.7 10.0 68 5.7 -.7 5.71 13.3 19 3.4 2.7 14 8.7 7.7 4.0 98 7.6 4.5 -0.8 3.7 -18.6 -20417.4 168 14.9-23. 29.3 -28.2 16.9 Line Gross domestic product 2 Personal consumption expenditures 3 Goods Durable goods Sble goods 6 Services 7 Gross private domestic investment 8 Fixed investment Nonresidential Structures Equipment Intellectual property products Residential 14 Change in private inventories 15 Net exports of goods and services 16 Exports 17 18 Services 19 Imports 20 Goods 9.7 7.3 1.0 12.1 16 8.0 0. 178 5.7 63 12.6 12.6 3.4 13.4 81 13.1 0.5 124 18.669 15 123 42 58 11.2 9.078 14.0 13.7 -$.3 2.1 11.2 10 109 3.2 326 94 7.5 15.7 21.3 6.0 12.0 3.9 54 2.7 134 88 44 38 05 49 256 36 1336 5.0 5.2 2.0 14.3 6.7 5.0 54 29 5.7 2. 2 4.2 04 3.8 2.0 6.9 64 8.5 21.3 1444 21.5 095 38 0.5 105 2.1 22 Government consumption expenditures and gross investment 2.0 -0.2 .3 0.3 5.2 0.1 0.6 3.3 0.6 3.7 1.8 3.1 0.9 3.4 4.5 -04 3.1 0.1 108 2.7 -36 6.0 24 67 35 6.8 6. 8.7 7.2 12 20 30 9.2 -06 78 128 33 9.3 2.5 7.4 6.7 7.4 0.1 -3.2 52 60 13.7 64 45 52 0.7 253 5.8 5.1 112 0.5 -0.1 0.2 04 1.8 1.5 13 7 24 1.9 08 1.0-2.2 0.3 Goods Services 23 Federal National defense 26 State and local 27 Gross domestie product, current dollars 7.9 4.7 74 59 84 4.4 3.5 5.0 5.0 5.0 43 4.1 -08 4.3 2008 2008 2009 2009 2009 2009 2010 2010 2010 2010 2011 2011 2011 2011 Line 03 04 1 2 3 04 Q1 2 03 04 01 2 3 04 2. 84 44 0.6 5 4.5 1.5 3.7 3.0 2.0 1.0 29 04.7 3.0 3.7 -0.9 1.6 2.8 -0.6 2.0 3.2 2.8 2.7 1.7 0.9 6 0. 8.1 -11.6 0 2.5 7.2 -21 3.0 56 3.0 5.7 20 1.5 0. 29 12.8 -26.3 0.7 -2.9 20.9 9.1 5.0 13.2 6.4 11.7 3.5-2.8 3.6 9.9 5.7 -38 -0.1 24 13 13 21 22 5 3.0 13 -08 14 -0. 0.2 05 -1.4 1.20.7 0.2 15 2. 2.7 12 16 2.1 2.3 -0.3 7.8 33.3 38.8 2 0.9 42.4 9.4 22.7 19. 1.3 73 174 13 34.6 9.7 -23.9 -28.213.7 1.5 2.0 -0.2 154 2.2 78 0.79.7 179 10.6 7.3 -21.3 26.9 16 2.3 2.7 28 13.8 13 8.0 -05 10.7 20. 10.6 2.4 -8.9 -26.6 -27.4 -24.6 -29.8 -24.2 12.0 5.7 7.9-26.3 308 26.0 14.5 12.0 -39,0 -37.7 -14.9 105 19.8 314 28.7 23.3 84 103 5.6 263 9.6 4.6 -28 -10.5 10.44.2 12.7 -6.6 -2.0 8.0 7.7 4.1 6.7 84 95 18.8 -33.6 -33.5 -224 199 -0.8 123 225 31.0 68 13 4.6 74 108 Gross domestic product 2 Personal consumption expenditures 3 Goods Durable goods Nondurable goods 6 Services 7 Gross private domestic investment 8 Fixed investment Intellectual property products 14 15 16 Change in private inventories Net exports of goods and services Exports 2.7 -20.4 -28.62 15.4 258 6.19.8 115 12. 3.4 6.6 4.3 4.2 0.5 -28.2 -35.6 22 21.0 308 12. 120 9.3 11.1 45 5.6 34 8S -10.2 1.4 -11.3 8.4 4.9 16. -5.7 5.1 16.7 14.3 12 9.1 6.4 -S.1 5.1 -13.9 34.0 15.6 178 209 10,0 199 155 3.3 26 24 4.6 5.6 -6.9 -17.6 -37.4 -18.9 213 24.7 12.5 23.9 6.7 3.5 4.7 0.4 4.0 6.7 .2 7.1 -17.3 13 5.2 6.2 02 3.2 99 20 72 13.2 7.8 02 22 Government consumption expenditures and gross investment 3.2 2.6 4.55.9 1 0.71.5 14 -2.7 -2.548 2.7 -5.6-0.3 5. 5.2 52 9.73.7 6.2 47 54 1.7 -06 54 14 84 16 94 6.1 12 10.73.1 4.6 22 2.9 -0.8 1.0 -7.1 1.7 -54 34 2.5 3.3 13.0 794.7 9 9.2 10 3.2 3.3 -22 -6.7 -13.6 112 2.0 4.13.5 0.6 -2.7 -5.51.3 3.4 -3.8 4.4 -3.5 -3.6 1.5 19 Imports 23 Federal National defense 26 State and local Addendum: 08 -7.2 4.5 -12 19 5.9 26 5.7 4.2 4.3 12 5.6 25 5.4 2012 2012 2012 2012 2013 2013 2013 2013 2014 2014 2014 2014 2015 2015 01 2 3 04 1 2 03 04 1 2 03 4 1 02 3.2 1.7 0.5 0.5 3.6 0.5 3.2 3.21.0 5. 4.99 3.3 3.3 33 0.6 0.7 1.8 2.1 0.3 6 3.5 1.6 4.4 4.54.7 3.5 3.4 2 -0.1 18 29 7.1 0.3 29 3.8 2.67.2 4.5 5.5444.8 10 08 5.3 94 10.7 18 3.4 4.4 6. 5.4 74 8. 66 94 3.0 0.5 0.2 00 54 -04 2.6 3.6 1.0 3.6 3.2 4.3 3.4 2.6 2.3 0.9 0.1 1.3 -0.3 0.3 1.0 3.3 1.0 3.04.4 4.3 3.1 2.7 8.6 9.5 18 3.5 15.8 4.6 16.4 15 4.0 6.7 7.6 .3 12.8 2.0 13.1 8.3 0.6 74 7.0 3.3 7.1 55 3.710.5 8.2 4.3 0.0 3.7 0.6 9.3 1.3 44 53 7.0 8.4 5.4 9.6 8.7 2.018 2.0 20.3 9.9 457.5 8.5 12.321.8 3.6 14.114.0 11 6.7 8.7 1.7 3.1 11.8 1.2 8.2 72 -0.9 0.0 16. 2.9 9.4 14.8 5.6 44 0.8 08 5.2 08 8.1 12.9 3.2 7.813 28 6.5 5.9 104 -5.0 4.0 26.5 3.5 10.722.5 15.3 13.4 74 -6. 3.5 14.4 6.3 149 7.5 11.0 Gross domestie product Personal consumption expenditures 2 Durable goods Nondurable goods 7 Gross private domestic investment Fixed investment Intellectual property products 14 15 16 Change in private inventories Net exports of goods and services 2.5 4.4 2. -0.5 4.6 4.9 2.5 12.2 2.1 8.3 14 4.7 -4.2 38 2.1 4.9 2.6 3.8 3. 6.6 2.6 16.7 6.1 10.0 344.69.4 6.5 3.4 3.5 1.1 7.4 8.1 1.3 24 3.1 7.3 4.7 2.8 5.0 7.4 -1.3 2.2 2.0 2.2 -3.8 12 5.9 2.9 2.2 5.1 10.4 0.6 11.0 6.6 3.2 2.1 1.7 2.34.2 18 6.4 3.2 2.4 6.1 1.0 0.6 11.7 7.8 3.6 2.6 34 16 2.0 19 3.5 5 0.3 7.3 0.7 8 13 19 22 Government consumption expenditures and gross investme1. -2.1 -0.6 3.9 3.5 -0.7 -2.1 3.1.4 0.0 2.8 0.42.3 40 0.0 3.2 0.8 78 89 -3.2 5.7 6.7 04 -3.8 4.7 5.9 22 10 2.6 48 1.0 19 -94 -2.57.9 -6 3.5 4.7 5.5 -11.0 0.0 08 4.7 -0.2 0.5 -02 79 -44 18 7.6 7.0 -2.2 3.5 2.5 5.5 14 2.9 1.31.6 02 1.0 0.2 -0.7 2.5 2.4 16 3.2 2.3 58 Exports 19 Imports 23 Federal National defense 26 State and local Addendum: 27 Gross domestic product, current dollars 5.8 3.3 2.6 2.5 5.3 1.7 5.2 5.7 0.5 7.8 6.92.7 3.0 5.7 492 1 3 .1 2015 2015 2016 2016 2016 2016 2017 2017 2017 2017 2018 2018 2018 03 4 1 2 3 04 01 2 3 94 01 2 03 1.0 0.4 1.5 2.3 9 18 18 3.0 2.8 2.3 2.2 4.2 3.4 2.9 2.3 2.4 3.4 2. 2.6 1.8 2.9 2.2 3.9 0.5 3.8 3.5 43 2.4 34 4.8 3.3 2.7 9 5.6 4.1 6.8 0.6 5.5 4.3 5.0 2.9 3.2 6.6 10.4 7.1 1.9 8.7 7.712.7 -2.0 8.6 3.7 4.0 2 3.5 39 0.1 06 19 4.0 2.3 4.0 0.1 4.0 4.6 22 2.2 2.0 2.8 24 2.5 1.7 17 14 2.6 0 3.0 3.2 1.2 58 -1.8 1.0 04 8.1 4.9 5.7 8.8 0.8 9.6 0.5 15.2 3.1 -1.9 19 28 3.2 1.7 99 4.3 2.6 62 8.0 64 11 1-3.9 1.2 38 46 00 9.6 73 34 48 115 8.7 2.5 -13.9 -20.6 4.0 3.3 12.6 1.2 12.8 38 5.7 1.3 13.9 14.5 -3.4 3 -44 -64 0.1 0.09 9.1 9.7 98 998.5 4.6 3.4 4.6 11. 8.7 9.6 5.5 0.4 8.0 6.6 7 0.7 14.1 10.5 5.6 14 58 13.7-1.0 1.7 7.7 11.1 -5.5 -0.5 3.4 1.3 -3.6 Gross domestic product 2 Personal consumption expenditures 3 Goods Durable goods Nondurable goods 6 Services 7 8 Gross private domestic investment Fixed investment Nonresidential Structures uipment 12 Intellectual property products Residential 15 Net exports of goods and services 6 3.5 -2.2 -24 34 6. -3.6 5.0 3.6 3.5 6.6 3.6 9.3 4.9 4.6 -4.8 02 3.6 7.73.1 4.2 4.2 2.1 109 3.2 13.5 -8.4 1.3 28 7.2 3.1 3.2 4.6 6.4 2.6 63 1.0 4.2 1.5 2.4 4.1 -0.4 0.5 08 4.9 62 4.8 2.5 2.8 118 3.0 -0.6 9.3 3.1 13 -04 1. 4.2 64 4.9 24 2.5 14.2 2.4 -04 10.5 8.9 3.8 44 0.7 7.95.7 45 3. 44 205.5 14 4.3 22 Government consumption expenditures and gross investment 1.9 0.7 3.4-0.8 1.0 0.2-0.8 0.0-1.0 2.4 1.5 2.5 2.6 06 2.3 02 -16 1605 00 24 13 4 26 3.7 3.5 4.0 2.6 1.1 -3.3 282 0.3 5.6 -2.9 2.9 3.0 5.9 4.9 46 19 2.1 10 -0.13.0 04 -2.0 11 5.72 05 16 Exports Goods 18 Services 19 Imports Goods Services 23 Federl 24 National defense Nondefenso State and local 26 Addendum: 27 Gross domestic product, current dollars 2.4 0.5 1.2 5.1 3.53.9 3.9 4.2 48 5. 4.3 7.6 4.9 Question 1 This question looks at the recessions over roughly the past 60 years. To work this problem, first obtain quarterly data on U.S. output growth for the period 1960 to the most recent date from www.bea.gov. . Go to www.bea.gov and click on "Tools" in the top menu click on "Interactive Data" Click on "GDP and Personal Income" . Click on "Begin using data" Click on "Section 1 . Click on the "Modify icon and then choose the range of 1960 to 2018 and quarterly data. Table 1.1.1 presents the percent change in real gross domestic product. This data can be downloaded to a spreadsheet. Did any quarters have negative growth? Using the definition of a recession as two or more consecutive quarters of negative growth, answer the following questions. Note: It is not necessary for you to print out all the data! a. How many recessions has the U.S. economy undergone since 1960, quarter 2? b. How many quarters has each recession lasted? C. In terms of length (number of quarters), which two recessions have been the most severe? If instead we consider the magnitude (total decline in GDP), which two recessions have been the most severe
