Answered step by step
Verified Expert Solution
Question
1 Approved Answer
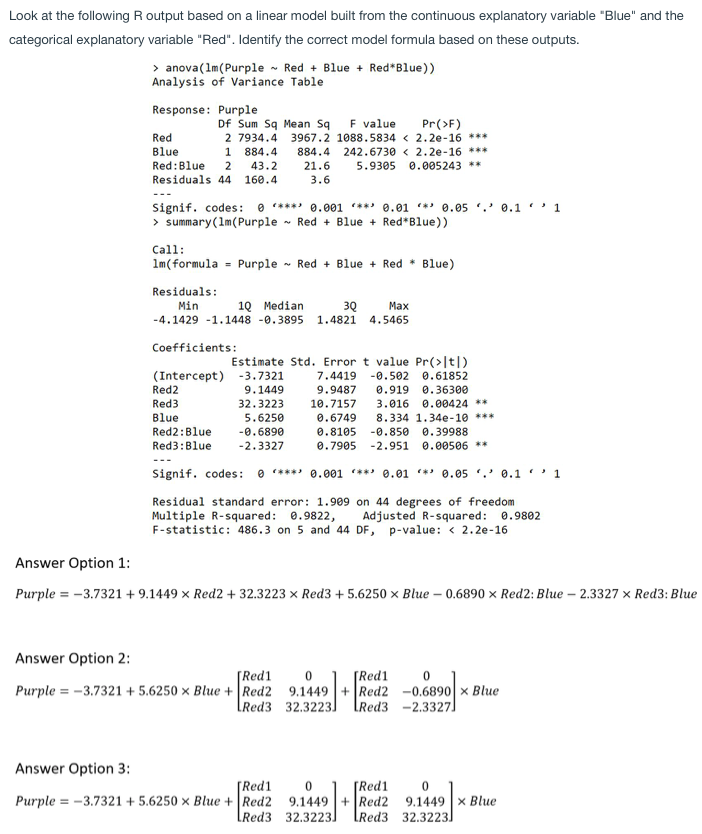
1a Answer option 4: none of the models are correct Look at the following Routput based on a linear model built from the continuous explanatory
1a

Answer option 4: none of the models are correct
Look at the following Routput based on a linear model built from the continuous explanatory variable "Blue" and the categorical explanatory variable "Red". Identify the correct model formula based on these outputs. > anova(Im(Purple - Red + Blue + Red*Blue)) Analysis of Variance Table Response: Purple Df Sum Sq Mean Sq F value Pr(>F) Red 2 7934.4 3967.2 1088.5834 summary(1m (Purple - Red + Blue + Red*Blue)) Call: Im(formula Purple - Red + Blue + Red * Blue) Residuals: Min 1Q Median 3Q Max -4.1429 -1.1448 -0.3895 1.4821 4.5465 Coefficients: Estimate Std. Error t value Pr(>It) (Intercept) -3.7321 7.4419 -0.502 0.61852 Red2 9.1449 9.9487 0.919 0.36300 Red3 32.3223 10.7157 3.016 0.00424 ** Blue 5.6250 0.6749 8.334 1.34e-10 *** Red2: Blue -0.6890 0.8105 -0.850 0.39988 Red3: Blue -2.3327 0.7905 -2.951 0.00506 ** Signif. codes: ***** 0.001 **** 0.01 **) 0.05 0.11 Residual standard error: 1.909 on 44 degrees of freedom Multiple R-squared: 0.9822, Adjusted R-squared: 0.9802 F-statistic: 486.3 on 5 and 44 DF, p-value: anova(Im(Purple - Red + Blue + Red*Blue)) Analysis of Variance Table Response: Purple Df Sum Sq Mean Sq F value Pr(>F) Red 2 7934.4 3967.2 1088.5834 summary(1m (Purple - Red + Blue + Red*Blue)) Call: Im(formula Purple - Red + Blue + Red * Blue) Residuals: Min 1Q Median 3Q Max -4.1429 -1.1448 -0.3895 1.4821 4.5465 Coefficients: Estimate Std. Error t value Pr(>It) (Intercept) -3.7321 7.4419 -0.502 0.61852 Red2 9.1449 9.9487 0.919 0.36300 Red3 32.3223 10.7157 3.016 0.00424 ** Blue 5.6250 0.6749 8.334 1.34e-10 *** Red2: Blue -0.6890 0.8105 -0.850 0.39988 Red3: Blue -2.3327 0.7905 -2.951 0.00506 ** Signif. codes: ***** 0.001 **** 0.01 **) 0.05 0.11 Residual standard error: 1.909 on 44 degrees of freedom Multiple R-squared: 0.9822, Adjusted R-squared: 0.9802 F-statistic: 486.3 on 5 and 44 DF, p-value:Step by Step Solution
There are 3 Steps involved in it
Step: 1

Get Instant Access to Expert-Tailored Solutions
See step-by-step solutions with expert insights and AI powered tools for academic success
Step: 2

Step: 3

Ace Your Homework with AI
Get the answers you need in no time with our AI-driven, step-by-step assistance
Get Started


