Question
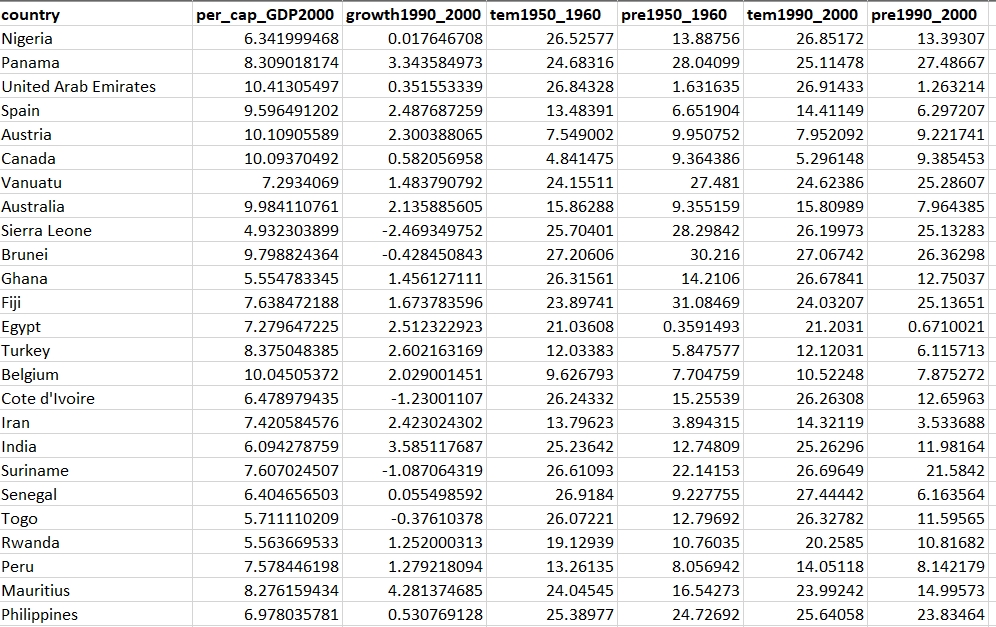
1.Has the globe been becoming warmer and drier over 1950-2000? Draw evidence on the descriptive statistics of relevant variables in the dataset. 2.Do hot countries
1.Has the globe been becoming warmer and drier over 1950-2000? Draw evidence on the descriptive statistics of relevant variables in the dataset.
2.Do hot countries tend to be poor (with lower per capita GDP)? Do dry countries tend to be poor? Use appropriate graphs to interpret the relationship between relevant variables. You only need to present tworelationships. Carefully interpret and explain.
3.Calculate the sample covariance and correlation for the two relationships in question 2 above using Data Analysis Tool Pack or Excel statistical functions. In addition, you are required to calculate the sample covariance and correlation using a second method (using basic Excel formulae without Data Analysis Tool Pack). The calculations by the second method should be carefully laid out in Excel and should NOT use any hard-wired Excel statistical functions e.g. COVARIANCE.S, CORREL, et al. You can use the Excel sort command, the sum command, and any other non-statistical excel commands. Carefully interpret your results.
4.Use simpleregression to explore the relationship between (i) annual growth of per capita GDP over 1990-2000 (Y) and mean temperature over 1990-2000 (X); (ii) annual growth of per capita GDP over 1990-2000 (Y) and mean precipitation over 1990-2000 (X), respectively. You may use Data Analysis Tool Pack for this. Based on the excel regression output, first write down the estimated regression equations, then carry out any relevant two-tailed hypothesis tests using the critical value approach at the 5% significance level. Carefully interpret your hypothesis test results.
5.Now use multipleregression to explore the relationship of annual growth of per capita GDP over 1990-2000 (Y) with, mean temperature over 1990-2000 (X1), and mean precipitation over 1990-2000 (X2). You may use Data Analysis Tool Pack for this. Based on the excel regression output, first write down the estimated regression equation,then interpret the estimated coefficients on the mean temperature over 1990-2000 (X1), and meanprecipitation over 1990-2000 (X2).Carry out any relevant two-tailed hypothesis tests using the p-valueapproach at the 5% significance level, and an overall significance test using the p-valueapproach. Carefully interpret your hypothesis test results.
6.Write down a paragraph or two to illustrate: a) why the hypothesis test is required in the above regression analysis (either simple or multiple); b) the underlying mechanism/intuition of a two-tailed hypothesis test in the context of regression analysis. Aid your illustration with appropriate diagrams.
7.Carefully interpret the adjusted R-squared in the multipleregression analysis.
8.If you could request additional data to study the factors that influence the annual growth of per capita GDP, what extra variables would you request? Illustratetwosuch variables. Carefully explain why you choose these two variables (by drawing evidence from the literature such as journal articles, newspapers, et al), types of your proposed variables (e.g. numerical or categorical), and how each of your proposed variables will be measured in the regression model.

Step by Step Solution
There are 3 Steps involved in it
Step: 1

Get Instant Access to Expert-Tailored Solutions
See step-by-step solutions with expert insights and AI powered tools for academic success
Step: 2

Step: 3

Ace Your Homework with AI
Get the answers you need in no time with our AI-driven, step-by-step assistance
Get Started


