1.How should Mohsen(digital marketing head at HBS online) allocate the FY21 digital marketing budget across various digital channels (Exhibit 9) and course offerings (Exhibit 10)? Consider the following as you decide on the budget allocation:
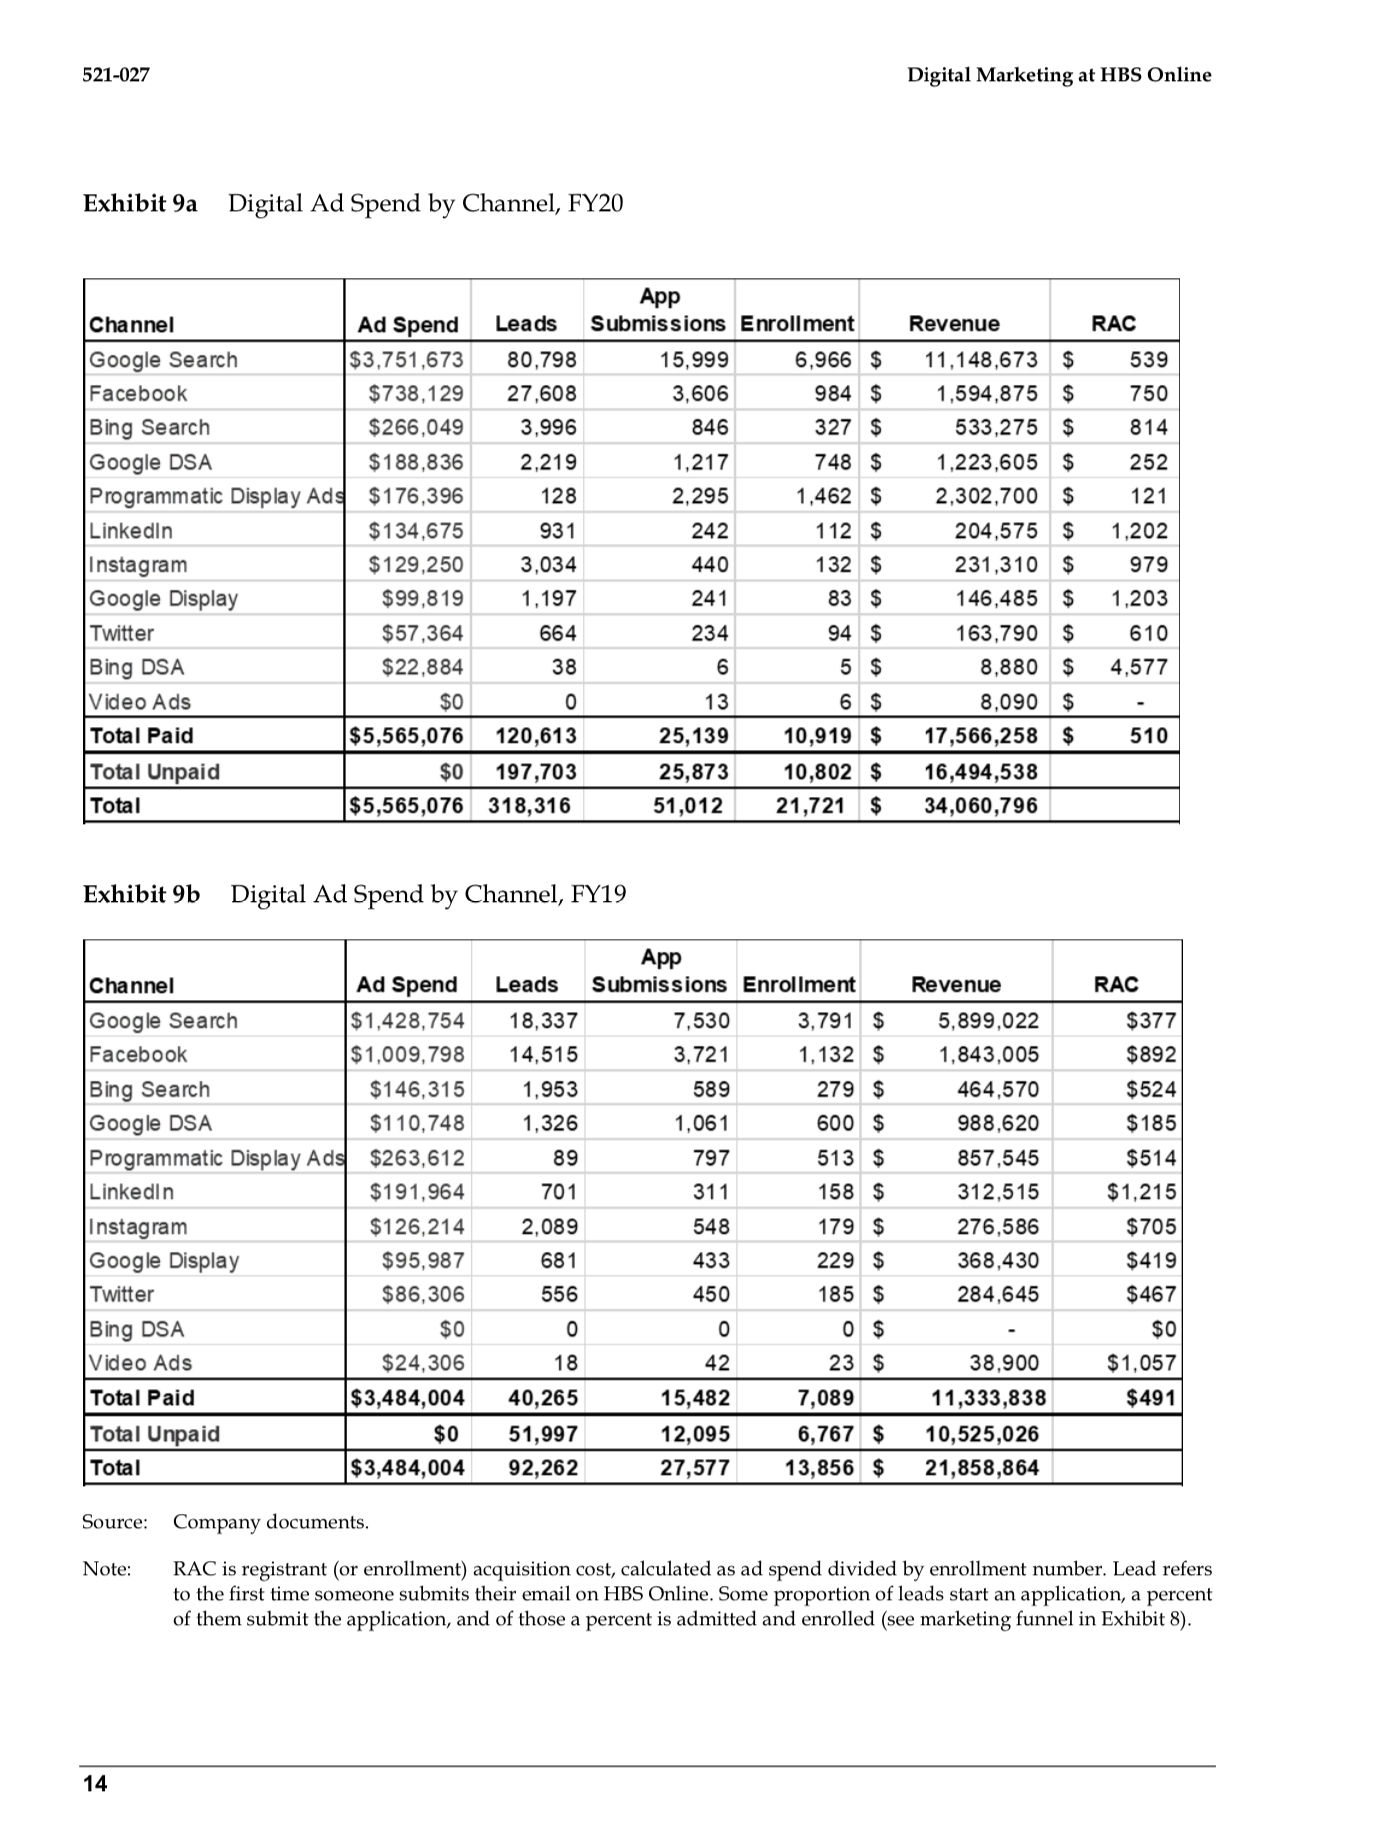
a.In FY20, Mohsen allocated only 3% of her ad budget on programmatic display ads even though they have the lowest acquisition cost (see Exhibit 9a). Why?
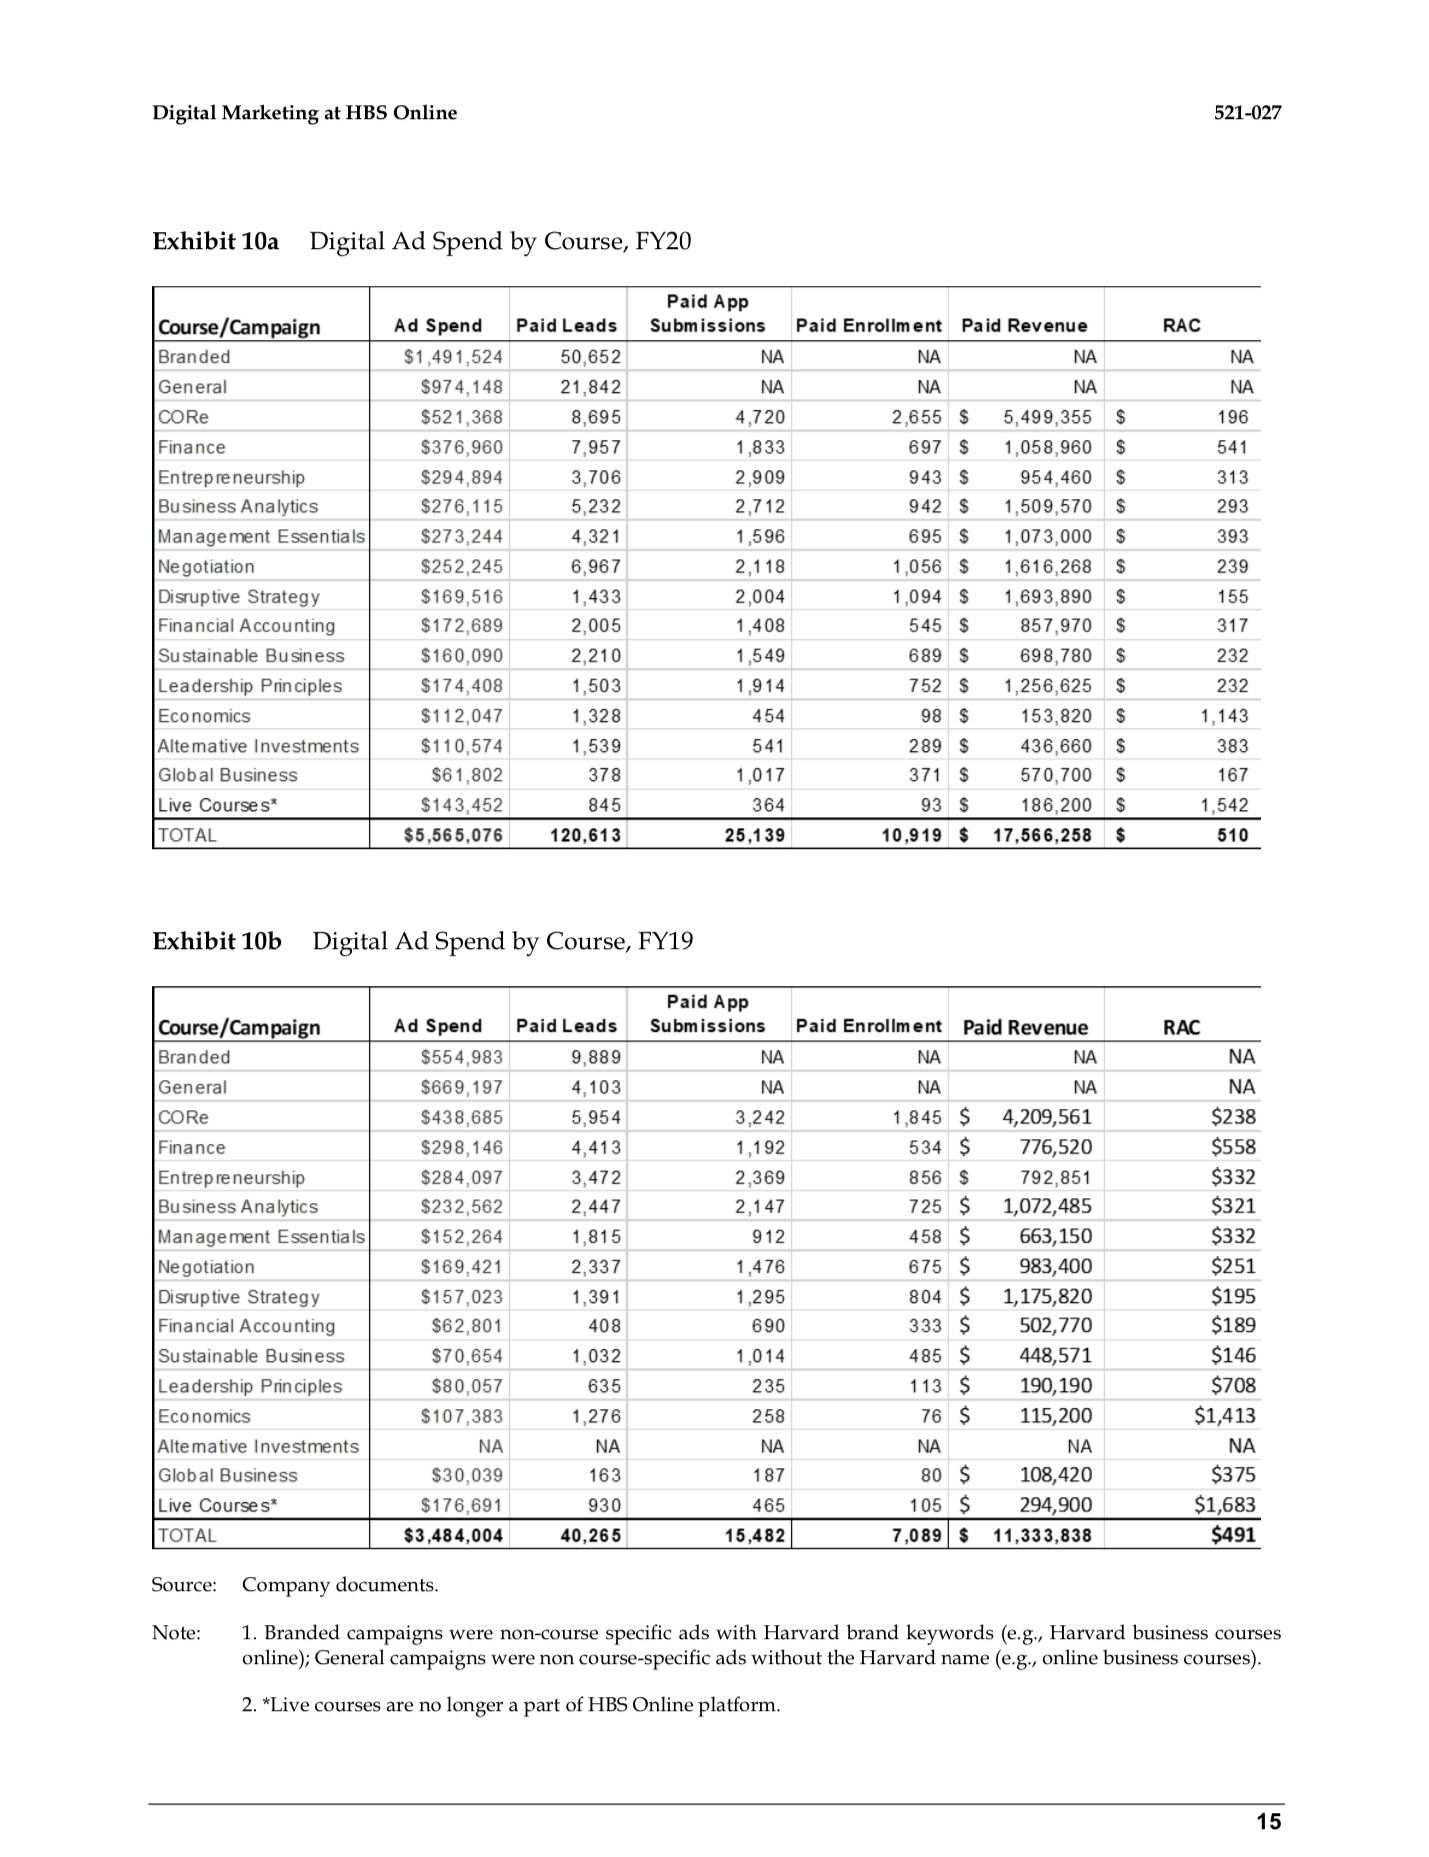
b.According to Exhibit 10, CORe accounted for almost 24% of overall revenue but only 9% of the total ad spend in FY20. Is Mohsen underspending on this course and overspending on others?
c.What is the best way to decide how much to spend on branded and generic ads (Ex 10)?
Exhibits are given below:
521-027 Digital Marketing at HBS Online Exhibit 9a Digital Ad Spend by Channel, FY20 App Channel Ad Spend Leads Submissions Enrollment Revenue RAC Google Search $3,751,673 80,798 15,999 5,966 $ 11,148,673 $ 539 Facebook $738,129 27,608 3,606 984 $ 1,594,875 750 Bing Search $266,049 3,996 846 327 $ 533,275 $ 814 Google DSA $188,836 2,219 1,217 748 $ 1,223,605 $ 252 Programmatic Display Ads $176,396 128 2,295 1,462 $ 2,302,700 $ 121 Linkedin $134,675 931 242 112 $ 204,575 $ 1,202 Instagram $129,250 3,034 440 132 $ 231,310 $ 979 Google Display $99,819 1,197 241 83 $ 146,485 1,203 Twitter $57,364 664 234 94 $ 163,790 $ 610 Bing DSA $22,884 38 5 $ 8,880 $ 4,577 Video Ads $0 13 6 $ 8,090 $ Total Paid $5,565,076 120,613 25, 139 10,919 $ 17,566,258 $ 510 Total Unpaid $0 197,703 25,873 10,802 $ 16,494,538 Total $5,565,076 318,316 51,012 21,721 $ 34,060,796 Exhibit 9b Digital Ad Spend by Channel, FY19 App Channel Ad Spend Leads Submissions Enrollment Revenue RAC Google Search $1,428,754 18,337 7,530 3,791 $ 5,899,022 $377 Facebook $1,009,798 14,515 3,721 1, 132 $ 1,843,005 $892 Bing Search $146,315 1,953 589 279 $ 464,570 $524 Google DSA $1 10,748 1,326 1,061 600 $ 988,620 $185 Programmatic Display Ads $263,612 89 797 513 $ 857,545 $514 Linkedin $191,964 701 311 158 $ 312,515 $1,215 Instagram $126,214 2,089 548 179 $ 276,586 $705 Google Display $95,987 681 433 229 $ 368,430 $419 Twitter $86,306 556 450 185 $ 284,645 $467 Bing DSA o $ $0 Video Ads $24,306 18 42 23 $ 38,900 $ 1,057 Total Paid $3,484,004 40,265 15,482 7,089 11,333,838 $491 Total Unpaid $0 51,997 12,095 5,767 $ 10,525,026 Total $3,484, 004 92,262 27,577 13,856 $ 21,858,864 Source: Company documents. Note: RAC is registrant (or enrollment) acquisition cost, calculated as ad spend divided by enrollment number. Lead refers to the first time someone submits their email on HBS Online. Some proportion of leads start an application, a percent of them submit the application, and of those a percent is admitted and enrolled (see marketing funnel in Exhibit 8). 14Digital Marketing at HBS Online 521-027 Exhibit 10a Digital Ad Spend by Course, FY20 Paid App Course/Campaign Ad Spend Paid Leads Submissions Paid Enrollment Paid Revenue RAC Branded $1 ,491,524 50,652 NA NA NA NA General $97 4, 148 21,842 NA NA NA NA $521,368 8,695 4,720 2,655 $ 5,499,355 $ 196 Finance $376,960 7,957 1,833 697 $ 1,058,960 $ 541 Entrepreneurship $294,894 3,706 2,909 943 $ 954, 460 $ 313 Business Analytics $276, 115 5,232 2,712 942 $ 1,509,570 $ 293 Management Essentials $273,244 4,321 1,596 695 $ 1,073,000 $ 393 Negotiation $252,245 6,967 2,1 18 1,056 $ 1,616,268 $ 239 Disruptive Strategy $169,516 1,433 2,004 1,094 $ 1,693,890 $ 155 Financial Accounting $172,689 2,005 1,408 545 $ 857,970 $ 317 Sustainable Business $160,090 2,210 1,549 689 $ 698,780 $ 232 Leadership Principles $174, 408 1,503 1,914 752 $ 1,256,625 $ 232 Economics $112,047 1,328 454 98 $ 153,820 $ 1,143 Altemative Investments $110,574 1,539 541 289 $ 436,660 383 Global Business $61,802 378 1,017 371 $ 570,700 $ 167 Live Courses* $143,452 845 364 93 $ 186,200 $ 1,542 TOTAL $5,565,076 120,613 25,139 10,919 $ 17,566,258 $ 510 Exhibit 10b Digital Ad Spend by Course, FY19 Paid App Course/Campaign Ad Spend Paid Leads Submissions Paid Enrollment Paid Revenue RAC Branded $554,983 9,889 NA NA NA NA General $669, 197 4, 103 NA NA NA NA CORE $438,685 5,954 3,242 ,845 $ 4,209,561 $238 Finance $298,146 4,413 1,192 534 $ 776,520 $558 Entrepreneurship $284,097 3,472 2,369 856 $ 792,851 $332 Business Analytics $232,562 2,447 2,147 725 $ 1,072,485 $321 Management Essentials $152,264 1,815 912 458 $ 663,150 $332 Negotiation $169,421 2,337 1,476 675 $ 983,400 $251 Disruptive Strategy $157,023 1,391 1,295 804 $ 1,175,820 $195 Financial Accounting $62,801 408 690 333 $ 502,770 $189 Sustainable Business $70,654 1,032 1,014 485 $ 448,571 $146 Leadership Principles $80,057 635 235 113 $ 190,190 BOL$ Economics $107,383 1,276 258 76 S 115,200 $1,413 Alte mative Investments NA NA NA NA NA NA Global Business $30,039 163 187 80 $ 108,420 $375 Live Courses $176,691 930 465 105 $ 294,900 $1,683 TOTAL 4.004 40,265 15,482 7,089 $ 11,333,838 $491 Source: Company documents. Note: 1. Branded campaigns were non-course specific ads with Harvard brand keywords (e.g., Harvard business courses online); General campaigns were non course-specific ads without the Harvard name (e.g., online business courses). 2. *Live courses are no longer a part of HBS Online platform. 15