

Answered step by step
Verified Expert Solution
Question
1 Approved Answer
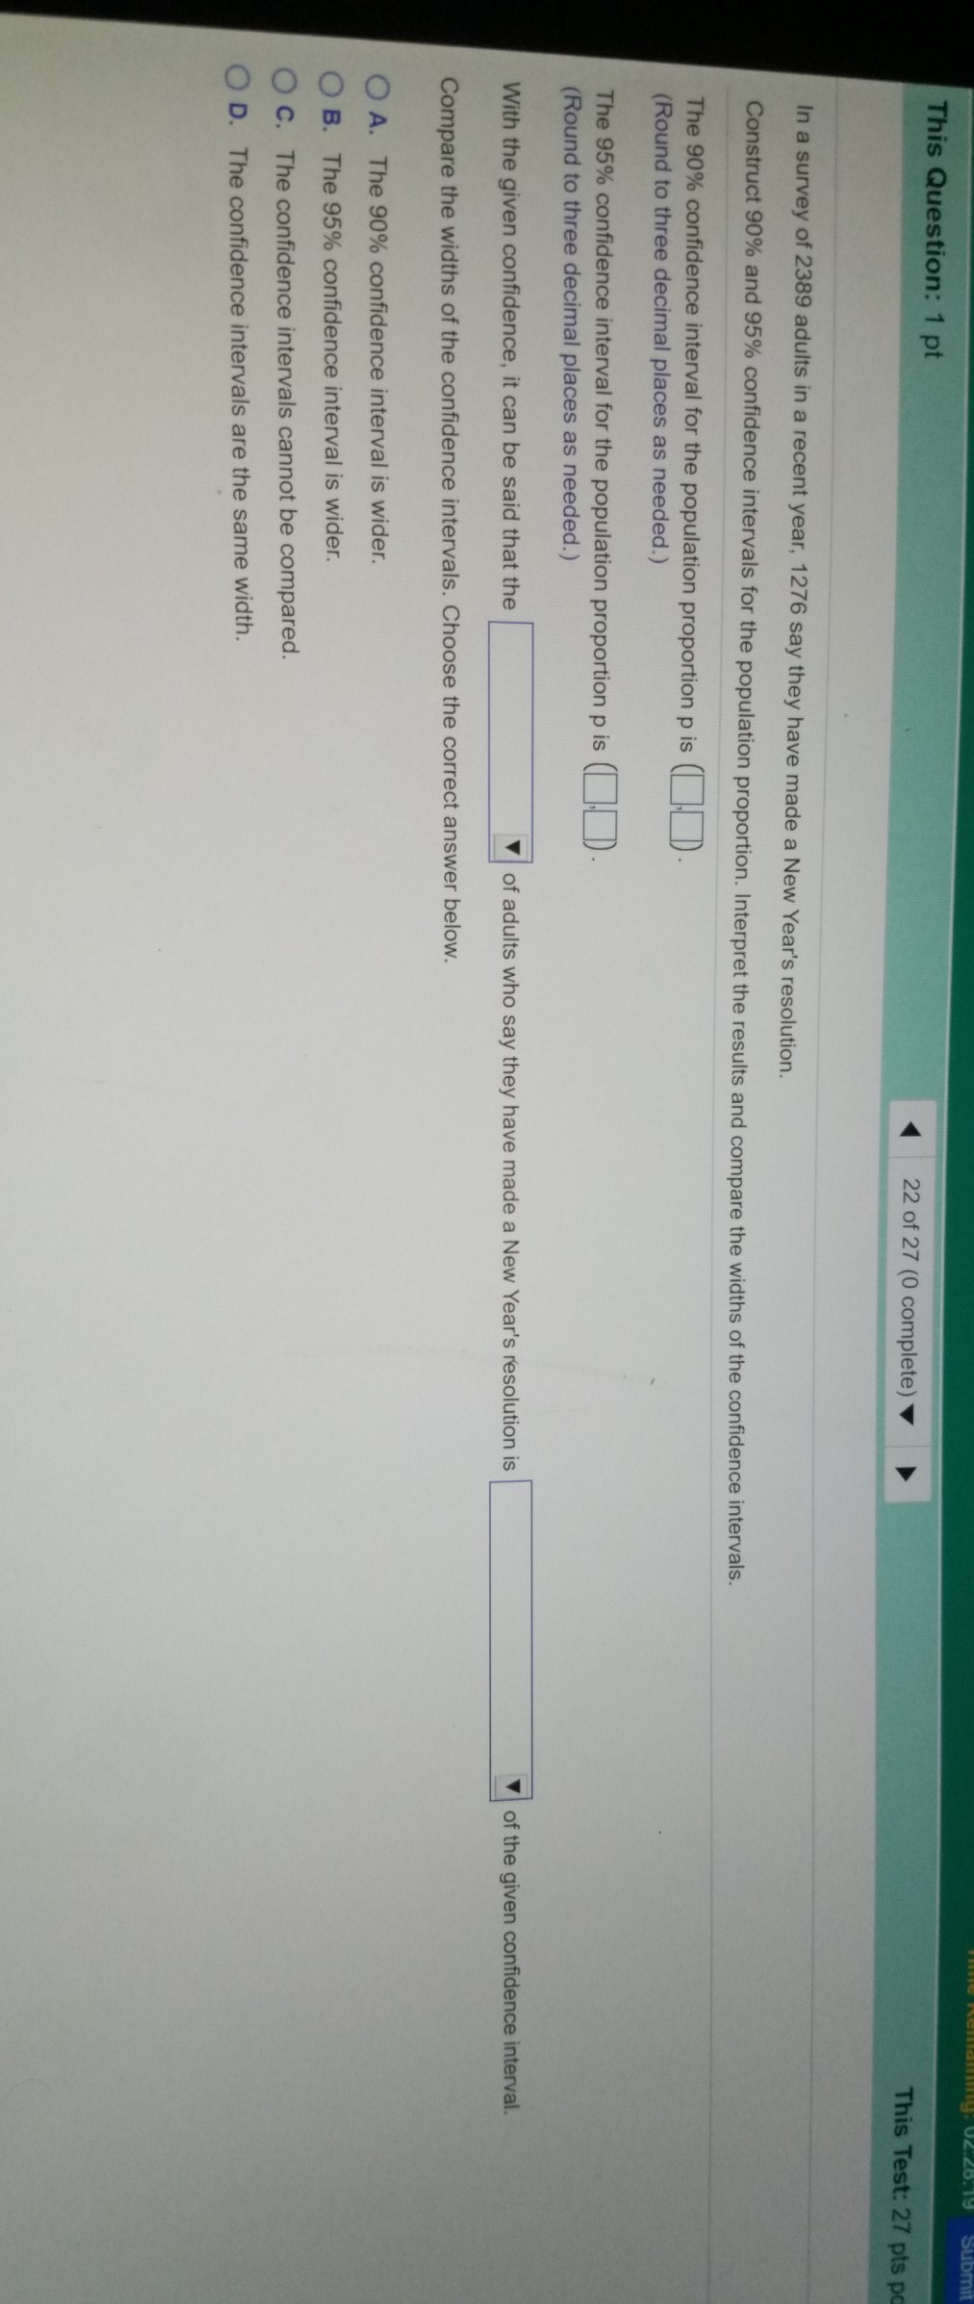
1st missing data (population proportion or sample proportion. 2nd missing data (less than the upper endpoint, between the endpoints, not between or greater than the
1st missing data (population proportion or sample proportion. 2nd missing data (less than the upper endpoint, between the endpoints, not between or greater than the lower endpoints)
Step by Step Solution
There are 3 Steps involved in it
Step: 1

Get Instant Access to Expert-Tailored Solutions
See step-by-step solutions with expert insights and AI powered tools for academic success
Step: 2

Step: 3
Ace Your Homework with AI
Get the answers you need in no time with our AI-driven, step-by-step assistance
Get Started
College Algebra
Authors: Robert F Blitzer
7th Edition
013449492X, 9780134453262