Answered step by step
Verified Expert Solution
Question
1 Approved Answer
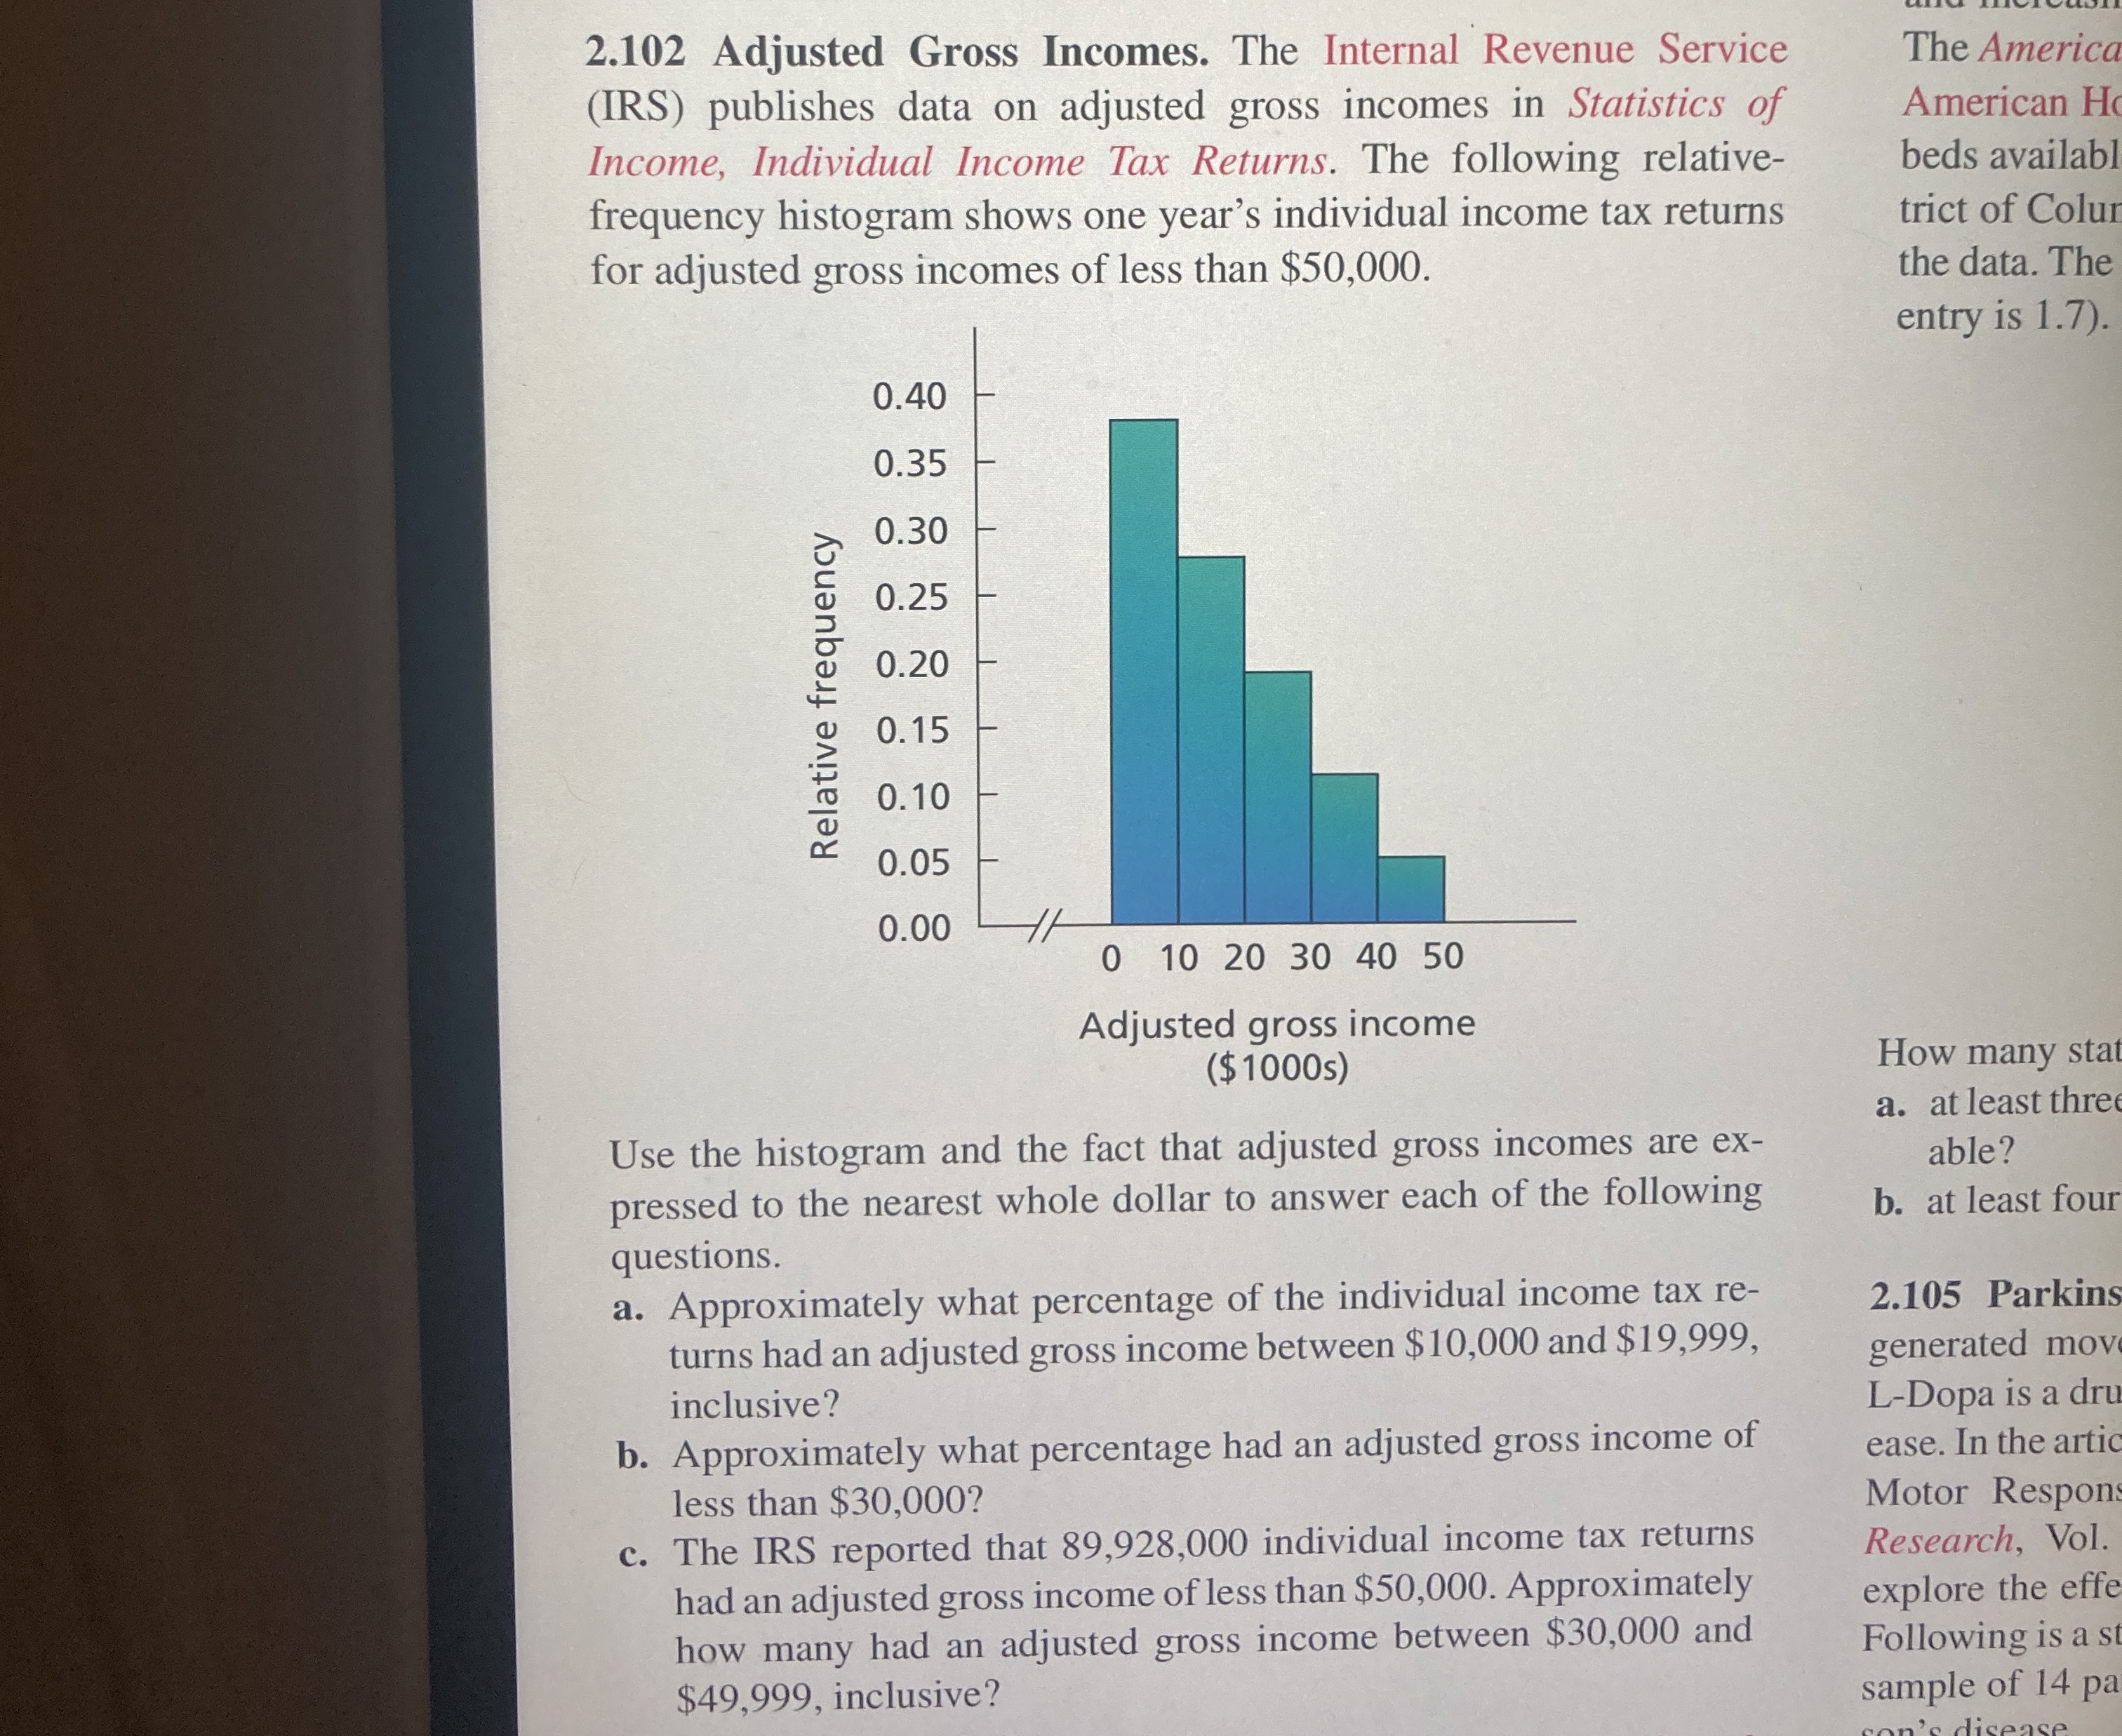
2 . 1 0 2 Adjusted Gross Incomes. The Internal Revenue Service ( IRS ) publishes data on adjusted gross incomes in Statistics of Income,
Adjusted Gross Incomes. The Internal Revenue Service
IRS publishes data on adjusted gross incomes in Statistics of
Income, Individual Income Tax Returns. The following relative
frequency histogram shows one year's individual income tax returns
for adjusted gross incomes of less than $
Use the histogram and the fact that adjusted gross incomes are ex
pressed to the nearest whole dollar to answer each of the following
questions.
a Approximately what percentage of the individual income tax re
turns had an adjusted gross income between $ and $
inclusive?
b Approximately what percentage had an adjusted gross income of
less than $
c The IRS reported that individual income tax returns
had an adjusted gross income of less than $ Approximately
how many had an adjusted gross income between $ and
$ inclusive?
The America
American Hc
beds availabl
trict of Colur
the data. The
entry is
How many stat
a at least thre
able?
b at least four
Parkins
generated mov
LDopa is a dru
ease. In the artic
Motor Respon
Research, Vol.
explore the effe
Following is a st
sample of pa

Step by Step Solution
There are 3 Steps involved in it
Step: 1

Get Instant Access to Expert-Tailored Solutions
See step-by-step solutions with expert insights and AI powered tools for academic success
Step: 2

Step: 3

Ace Your Homework with AI
Get the answers you need in no time with our AI-driven, step-by-step assistance
Get Started


