Answered step by step
Verified Expert Solution
Question
1 Approved Answer
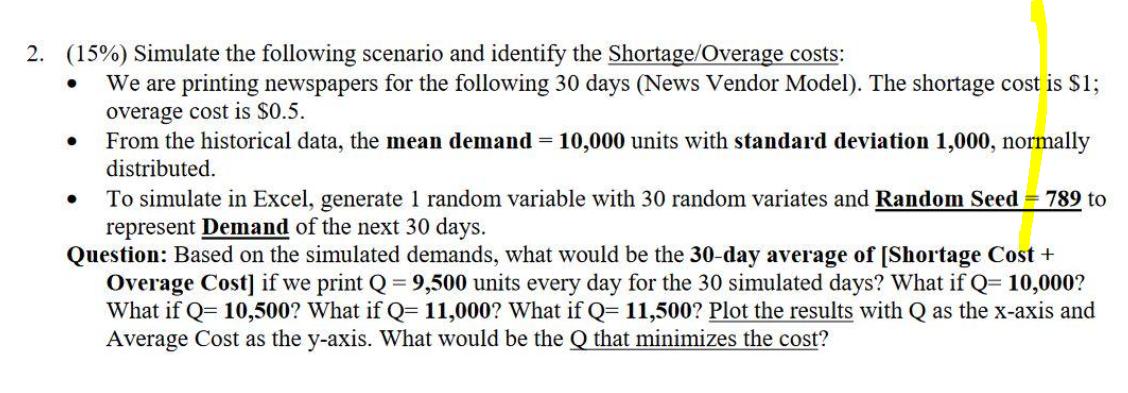
2. (15%) Simulate the following scenario and identify the Shortage/Overage costs: We are printing newspapers for the following 30 days (News Vendor Model). The

2. (15%) Simulate the following scenario and identify the Shortage/Overage costs: We are printing newspapers for the following 30 days (News Vendor Model). The shortage cost is $1; overage cost is $0.5. From the historical data, the mean demand = 10,000 units with standard deviation 1,000, normally distributed. To simulate in Excel, generate 1 random variable with 30 random variates and Random Seed = 789 to represent Demand of the next 30 days. Question: Based on the simulated demands, what would be the 30-day average of [Shortage Cost + Overage Cost] if we print Q = 9,500 units every day for the 30 simulated days? What if Q= 10,000? What if Q= 10,500? What if Q= 11,000? What if Q= 11,500? Plot the results with Q as the x-axis and Average Cost as the y-axis. What would be the Q that minimizes the cost?
Step by Step Solution
★★★★★
3.52 Rating (176 Votes )
There are 3 Steps involved in it
Step: 1
The 30day average of Shortage Cost Overage Cost for e...
Get Instant Access to Expert-Tailored Solutions
See step-by-step solutions with expert insights and AI powered tools for academic success
Step: 2

Step: 3

Ace Your Homework with AI
Get the answers you need in no time with our AI-driven, step-by-step assistance
Get Started


