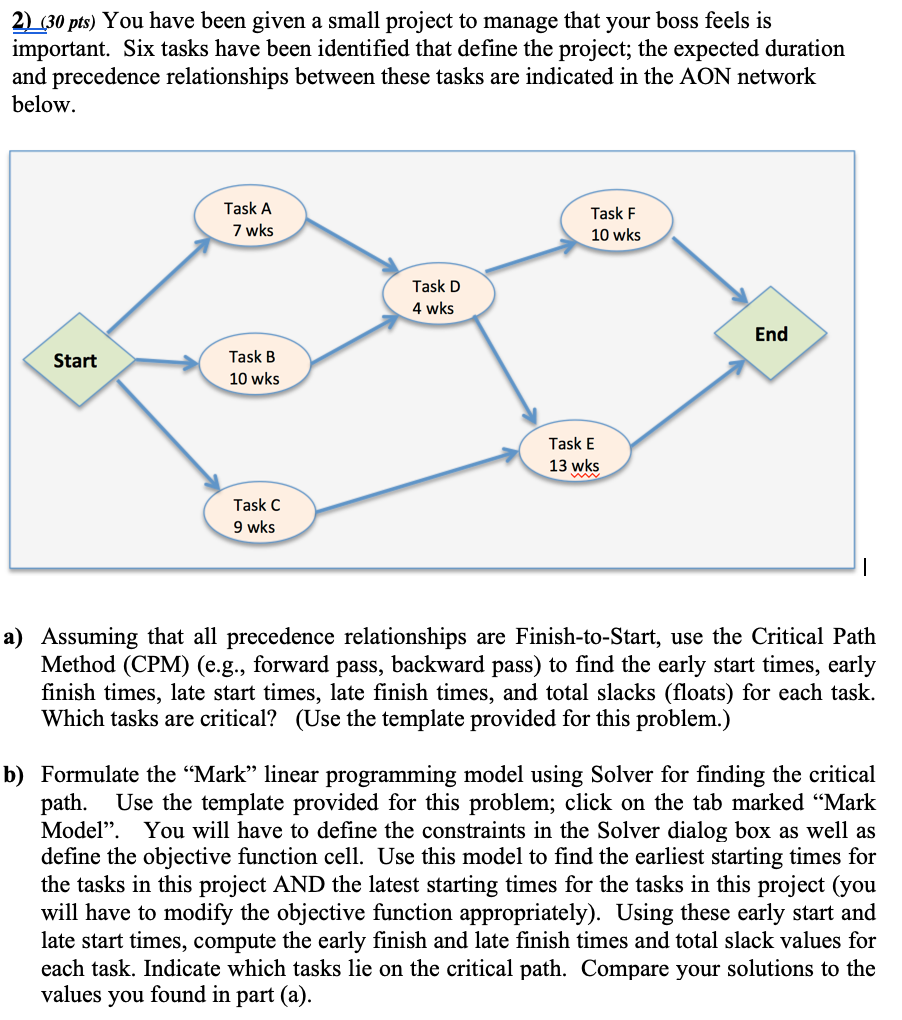

2) (30 pts) You have been given a small project to manage that your boss feels is important. Six tasks have been identified that define the project; the expected duration and precedence relationships between these tasks are indicated in the AON network below. Task A 7 wks Task F 10 wks Task D 4 wks End Start Task B 10 wks Task E 13 wks Task C 9 wks a) Assuming that all precedence relationships are Finish-to-Start, use the Critical Path hod (CPM) (e.g., forward pass, backward pass) to find the early start times, early finish times, late start times, late finish times, and total slacks (floats) for each task. Which tasks are critical? (Use the template provided for this problem.) b) Formulate the Mark linear programming model using Solver for finding the critical path. Use the template provided for this problem; click on the tab marked Mark Model. You will have to define the constraints in the Solver dialog box as well as define the objective function cell. Use this model to find the earliest starting times for the tasks in this project AND the latest starting times for the tasks in this project (you will have to modify the objective function appropriately). Using these early start and late start times, compute the early finish and late finish times and total slack values for each task. Indicate which tasks lie on the critical path. Compare your solutions to the values you found in part (a). c) Formulate the "Gary linear programming using Solver model to replicate the calcuations in part (b). Use the template provided for this problem; click on the tab marked "Gary Model. d) Analyze this project using MS Project 2013 or 2016. Show that the critical path, slack values, etc. correspond to the values calculated in parts (a) and (b) above. Make sure that your MS Project output shows the total slack values as well as the start and finish dates, etc. Using the early start dates, develop a Gantt chart for this project. Take a screen shot of your input and Gantt chart and paste this into your solution. 2) (30 pts) You have been given a small project to manage that your boss feels is important. Six tasks have been identified that define the project; the expected duration and precedence relationships between these tasks are indicated in the AON network below. Task A 7 wks Task F 10 wks Task D 4 wks End Start Task B 10 wks Task E 13 wks Task C 9 wks a) Assuming that all precedence relationships are Finish-to-Start, use the Critical Path hod (CPM) (e.g., forward pass, backward pass) to find the early start times, early finish times, late start times, late finish times, and total slacks (floats) for each task. Which tasks are critical? (Use the template provided for this problem.) b) Formulate the Mark linear programming model using Solver for finding the critical path. Use the template provided for this problem; click on the tab marked Mark Model. You will have to define the constraints in the Solver dialog box as well as define the objective function cell. Use this model to find the earliest starting times for the tasks in this project AND the latest starting times for the tasks in this project (you will have to modify the objective function appropriately). Using these early start and late start times, compute the early finish and late finish times and total slack values for each task. Indicate which tasks lie on the critical path. Compare your solutions to the values you found in part (a). c) Formulate the "Gary linear programming using Solver model to replicate the calcuations in part (b). Use the template provided for this problem; click on the tab marked "Gary Model. d) Analyze this project using MS Project 2013 or 2016. Show that the critical path, slack values, etc. correspond to the values calculated in parts (a) and (b) above. Make sure that your MS Project output shows the total slack values as well as the start and finish dates, etc. Using the early start dates, develop a Gantt chart for this project. Take a screen shot of your input and Gantt chart and paste this into your solution


