Answered step by step
Verified Expert Solution
Question
1 Approved Answer
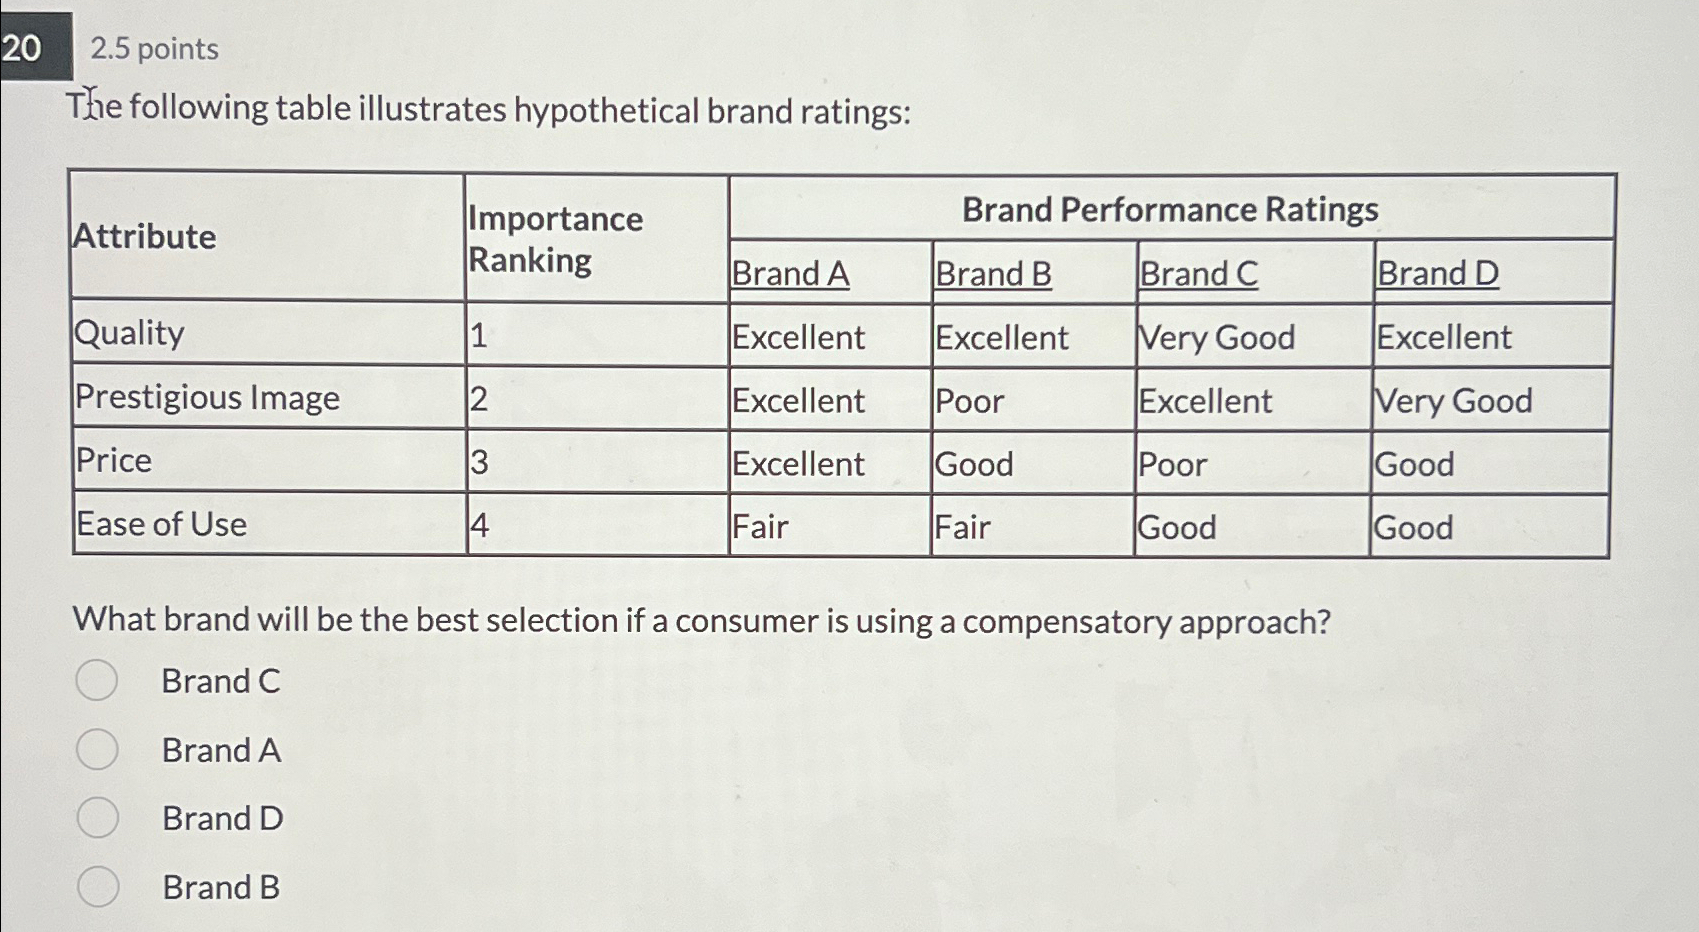
2 . 5 points The following table illustrates hypothetical brand ratings: table [ [ Attribute , table [ [ Importance ] , [
points
The following table illustrates hypothetical brand ratings:
tableAttributetableImportanceRankingBrand Performance RatingsBrand ABrand BBrand CBrand DQualityExcellent,Excellent,Very Good,ExcellentPrestigious Image,Excellent,Poor,Excellent,Very GoodPriceExcellent,Good,Poor,GoodEase of Use,Fair,Fair,Good,Good
What brand will be the best selection if a consumer is using a compensatory approach?
Brand C
Brand A
Brand D
Brand B

Step by Step Solution
There are 3 Steps involved in it
Step: 1

Get Instant Access to Expert-Tailored Solutions
See step-by-step solutions with expert insights and AI powered tools for academic success
Step: 2

Step: 3

Ace Your Homework with AI
Get the answers you need in no time with our AI-driven, step-by-step assistance
Get Started


