Answered step by step
Verified Expert Solution
Question
1 Approved Answer
2. A financial analyst measures the monthly returns of two stocks (A and B) over a twenty year period. Over that time period, stock A
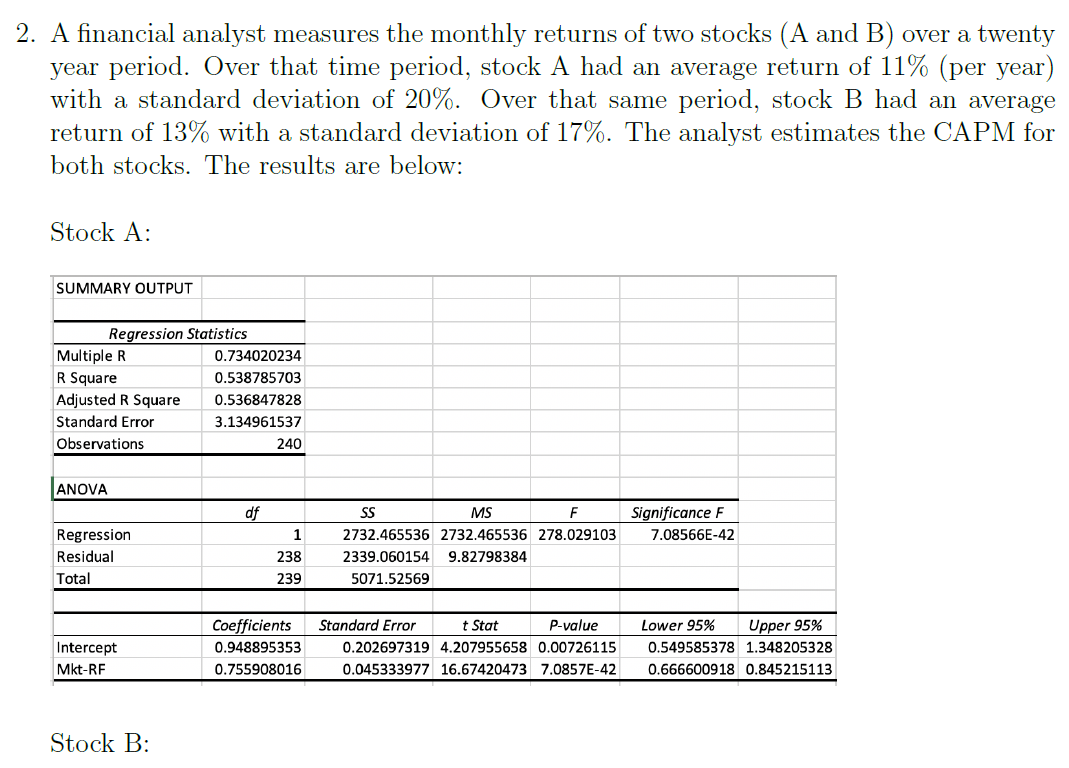
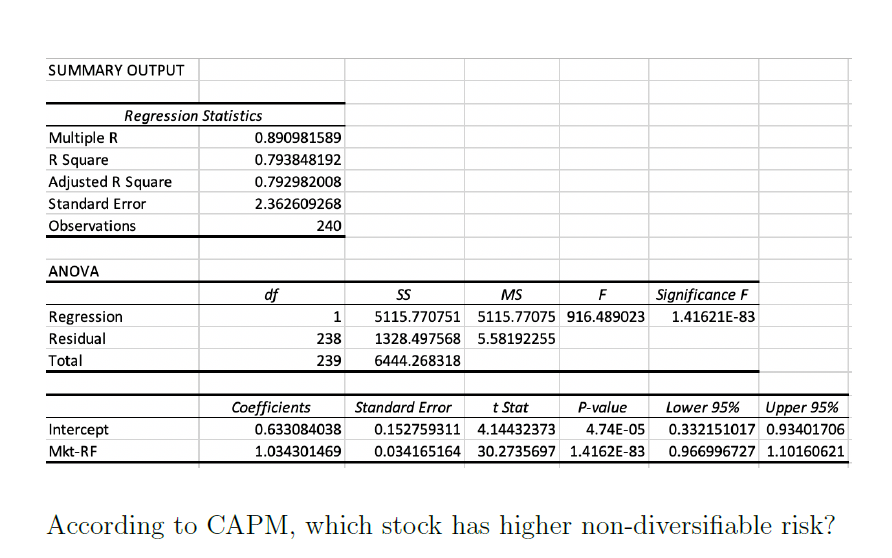
2. A financial analyst measures the monthly returns of two stocks (A and B) over a twenty year period. Over that time period, stock A had an average return of 11% (per year) with a standard deviation of 20%. Over that same period, stock B had an average return of 13% with a standard deviation of 17%. The analyst estimates the CAPM for both stocks. The results are below: Stock A: SUMMARY OUTPUT Regression Statistics Multiple R 0.734020234 R Square 0.538785703 Adjusted R Square 0.536847828 Standard Error 3.134961537 Observations 240 ANOVA df 1 Regression Residual Total SS MS F Significance F 2732.465536 2732.465536 278.0291037.08566E-42 2339.060154 9.82798384 5071.52569 238 239 Intercept Mkt-RF Coefficients 0.948895353 0.755908016 Standard Error t Stat P-value 0.202697319 4.207955658 0.00726115 0.045333977 16.67420473 7.0857E-42 Lower 95% Upper 95% 0.549585378 1.348205328 0.666600918 0.845215113 Stock B: SUMMARY OUTPUT Regression Statistics Multiple R 0.890981589 R Square 0.793848192 Adjusted R Square 0.792982008 Standard Error 2.362609268 Observations 240 ANOVA SS Significance F 1.41621E-83 Regression Residual Total MS 5115.770751 5115.77075 916.489023 1328.497568 5.58192255 6444.268318 238 239 Intercept Mkt-RF Coefficients Standard Error 0.633084038 0.152759311 1.0343014690.034165164 t Stat P-value 4.14432373 4.74E-05 30.2735697 1.4162E-83 Lower 95% Upper 95% 0.332151017 0.93401706 0.966996727 1.10160621 According to CAPM, which stock has higher non-diversifiable risk
Step by Step Solution
There are 3 Steps involved in it
Step: 1
Get Instant Access to Expert-Tailored Solutions
See step-by-step solutions with expert insights and AI powered tools for academic success
Step: 2
Step: 3
Ace Your Homework with AI
Get the answers you need in no time with our AI-driven, step-by-step assistance
Get Started