Question
2 (a) Find the best linear (straight line) fit to the data in the table below. Assume that the measurement uncertainty (in y) is

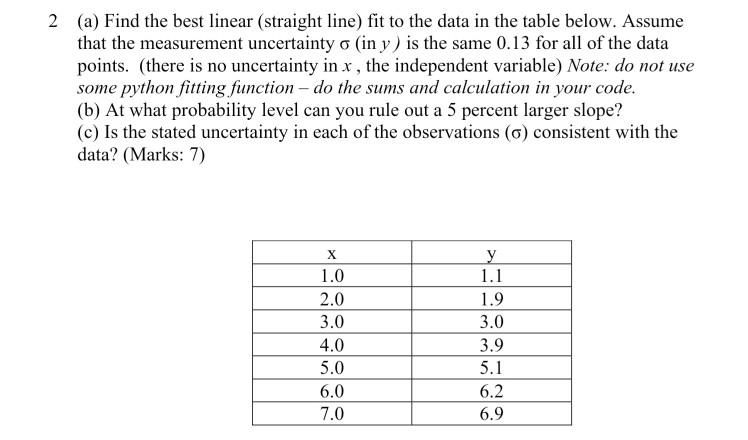
2 (a) Find the best linear (straight line) fit to the data in the table below. Assume that the measurement uncertainty (in y) is the same 0.13 for all of the data points. (there is no uncertainty in x, the independent variable) Note: do not use some python fitting function - do the sums and calculation in your code. (b) At what probability level can you rule out a 5 percent larger slope? (c) Is the stated uncertainty in each of the observations (6) consistent with the data? (Marks: 7) X y 1.0 1.1 2.0 1.9 3.0 3.0 4.0 3.9 5.0 5.1 6.0 6.2 7.0 6.9
Step by Step Solution
There are 3 Steps involved in it
Step: 1
To find the best linear fit to the data and answer the other questions we can follow these steps 1 C...
Get Instant Access to Expert-Tailored Solutions
See step-by-step solutions with expert insights and AI powered tools for academic success
Step: 2

Step: 3

Ace Your Homework with AI
Get the answers you need in no time with our AI-driven, step-by-step assistance
Get StartedRecommended Textbook for
Applied Linear Algebra
Authors: Peter J. Olver, Cheri Shakiban
1st edition
131473824, 978-0131473829
Students also viewed these Programming questions
Question
Answered: 1 week ago
Question
Answered: 1 week ago
Question
Answered: 1 week ago
Question
Answered: 1 week ago
Question
Answered: 1 week ago
Question
Answered: 1 week ago
Question
Answered: 1 week ago
Question
Answered: 1 week ago
Question
Answered: 1 week ago
Question
Answered: 1 week ago
Question
Answered: 1 week ago
Question
Answered: 1 week ago
Question
Answered: 1 week ago
Question
Answered: 1 week ago
Question
Answered: 1 week ago
Question
Answered: 1 week ago
Question
Answered: 1 week ago
Question
Answered: 1 week ago
Question
Answered: 1 week ago
Question
Answered: 1 week ago
Question
Answered: 1 week ago
Question
Answered: 1 week ago
Question
Answered: 1 week ago
View Answer in SolutionInn App


