Answered step by step
Verified Expert Solution
Question
1 Approved Answer
2. A nearby town has a population of 10,000 people. All people in this town make eractly the same income of 50 thousand CAD per
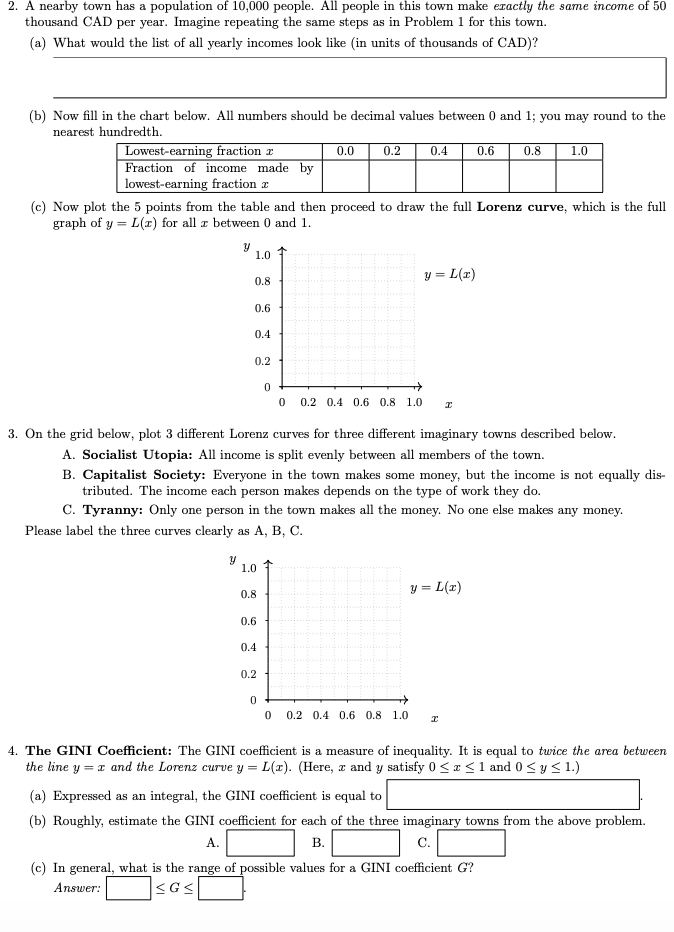
2. A nearby town has a population of 10,000 people. All people in this town make eractly the same income of 50 thousand CAD per year. Imagine repeating the same steps as in Problem 1 for this town. (a) What would the list of all yearly incomes look like in units of thousands of CAD)? (b) Now fill in the chart below. All numbers should be decimal values between 0 and 1; you may round to the nearest hundredth. Lowest-earning fraction : 0.0 0.2 0.4 0.6 0.8 1.0 Fraction of income made by lowest-earning fraction 2 (c) Now plot the 5 points from the table and then proceed to draw the full Lorenz curve, which is the full graph of y = L(x) for all z between 0 and 1. 1.0 y=L(2) 0.8 0.6 0.4 0.2 0 0 0.2 0.4 0.6 0.8 1.0 3. On the grid below, plot 3 different Lorenz curves for three different imaginary towns described below. A. Socialist Utopia: All income is split evenly between all members of the town. B. Capitalist Society: Everyone in the town makes some money, but the income is not equally dis- tributed. The income each person makes depends on the type of work they do. C. Tyranny: Only one person in the town makes all the money. No one else makes any money. Please label the three curves clearly as A, B, C. y 1.0 1 0.8 =L() 0.6 0.4 0.2 0 0 0.2 0.4 0.6 0.8 1.0 4. The GINI Coefficient: The GINI coefficient is a measure of inequality. It is equal to twice the area between the line y = I and the Lorenz curve y = L(1). (Here, I and y satisfy 0
Step by Step Solution
There are 3 Steps involved in it
Step: 1
Get Instant Access to Expert-Tailored Solutions
See step-by-step solutions with expert insights and AI powered tools for academic success
Step: 2
Step: 3
Ace Your Homework with AI
Get the answers you need in no time with our AI-driven, step-by-step assistance
Get Started