

Question
Show on excel use 2006 as the base Q1: possible effect of reducing prices by 10% on income and breakeven Q2 possible effect of eliminating
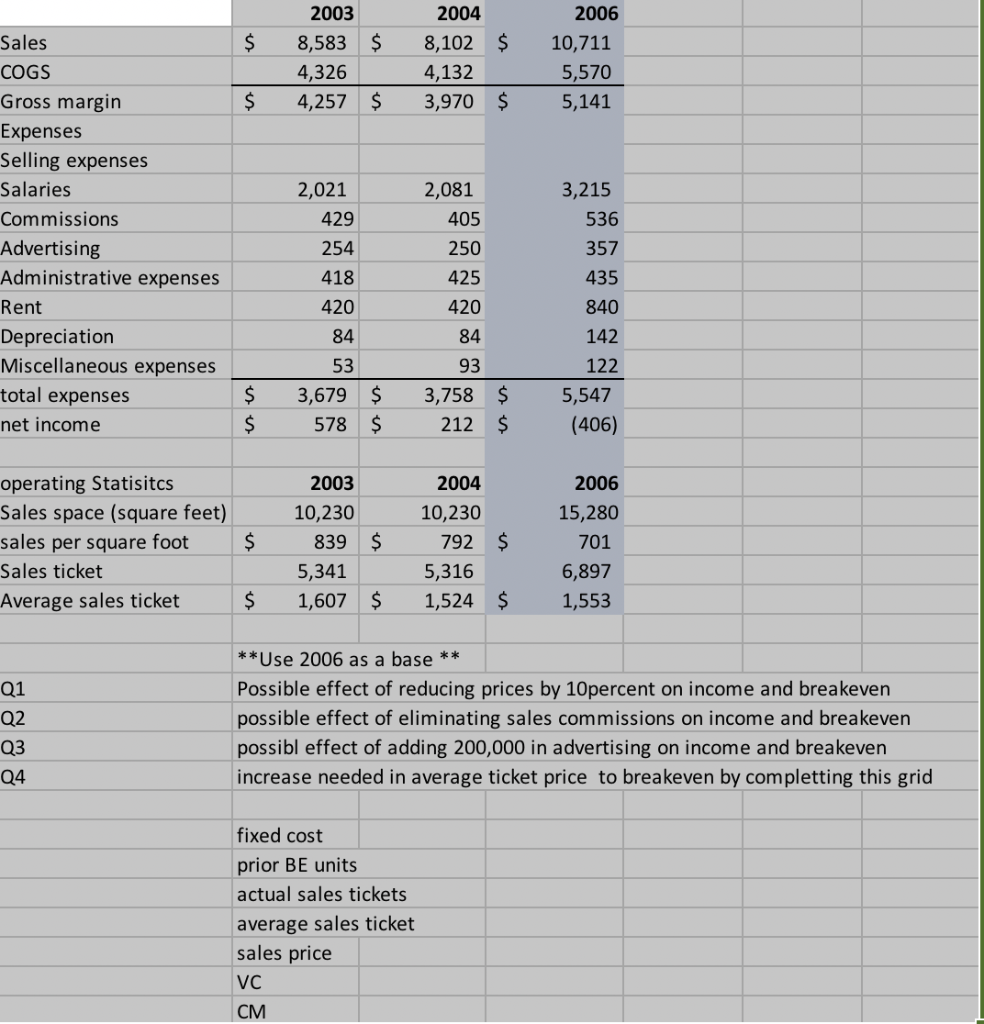
Show on excel
use 2006 as the base
Q1: possible effect of reducing prices by 10% on income and breakeven
Q2 possible effect of eliminating sales commission on income and breakeven
Q3 possible effect of adding 200,000in advertising on income and breakeven
q4 increase needed in average ticket price to breakeven by completing this grid
2003 2004 2006 $ 8,583 8,102 10,711 5,570 $4,257 $3,970 5,141 Sales COGS Gross margin Expenses Selling expenses Salaries Commissions Advertising Administrative expenses Rent Depreciation Miscellaneous expenses total expenses net income 4,326 4,132 2,021 429 254 418 420 84 53 2,081 405 250 425 420 84 93 3,215 536 357 435 840 142 122 $ 3,679 $ 3,758 5,547 $578 $212$ (406) 2003 2004 10,230 operating Statisitcs Sales space (square feet) sales per square foot Sales ticket Average sales ticket 2006 15,280 701 6,897 10,230 839$ 792 $ 5,316 1,607$1,524 1,553 5,341 Q1 Q2 03 Q4 **Use 2006 as a base** Possible effect of reducing prices by 10percent on income and breakeven possible effect of eliminating sales commissions on income and breakeven possibl effect of adding 200,000 in advertising on income and breakeven increase needed in average ticket price to breakeven by completting this grid fixed cost prior BE units actual sales tickets average sales ticket sales price VC CM 2003 2004 2006 $ 8,583 8,102 10,711 5,570 $4,257 $3,970 5,141 Sales COGS Gross margin Expenses Selling expenses Salaries Commissions Advertising Administrative expenses Rent Depreciation Miscellaneous expenses total expenses net income 4,326 4,132 2,021 429 254 418 420 84 53 2,081 405 250 425 420 84 93 3,215 536 357 435 840 142 122 $ 3,679 $ 3,758 5,547 $578 $212$ (406) 2003 2004 10,230 operating Statisitcs Sales space (square feet) sales per square foot Sales ticket Average sales ticket 2006 15,280 701 6,897 10,230 839$ 792 $ 5,316 1,607$1,524 1,553 5,341 Q1 Q2 03 Q4 **Use 2006 as a base** Possible effect of reducing prices by 10percent on income and breakeven possible effect of eliminating sales commissions on income and breakeven possibl effect of adding 200,000 in advertising on income and breakeven increase needed in average ticket price to breakeven by completting this grid fixed cost prior BE units actual sales tickets average sales ticket sales price VC CMStep by Step Solution
There are 3 Steps involved in it
Step: 1

Get Instant Access to Expert-Tailored Solutions
See step-by-step solutions with expert insights and AI powered tools for academic success
Step: 2

Step: 3
Ace Your Homework with AI
Get the answers you need in no time with our AI-driven, step-by-step assistance
Get Started
Secretarial Audits Under Corporate Laws And Annual Return Certification
Authors: CS Shilpa Dixit And CS Amogh Diwan CS Milind Kasodekar
1st Edition
9389449324, 978-9389449327