Answered step by step
Verified Expert Solution
Link Copied!

Question

1 Approved Answer

2. A random sample of 25 Division I-A Football teams is selected and the points they score during the first week of the 2009 season
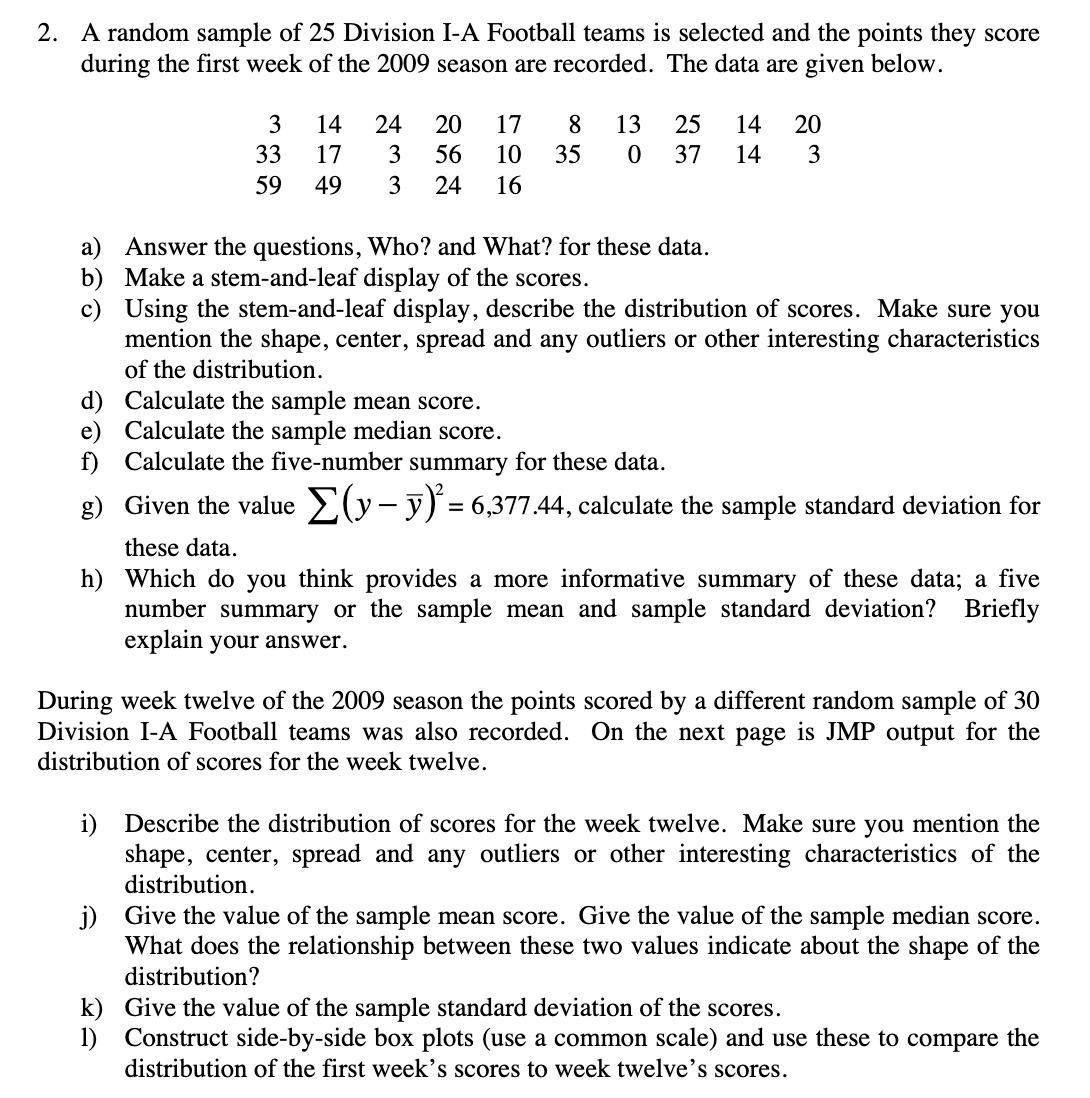
image text in transcribed
2. A random sample of 25 Division I-A Football teams is selected and the points they score during the first week of the 2009 season are recorded. The data are given below. 3 14 24 20 17 8 13 25 14 20 33 17 3 56 10 35 0 37 14 3 59 49 3 24 16 a) Answer the questions, Who? and What? for these data. b) Make a stemand-leaf display of the scores. c) Using the stem-andleaf display, describe the distribution of scores. Make sure you mention the shape, center, spread and any outliers or other interesting characteristics of the distribution. d) Calculate the sample mean score. e) Calculate the sample median score. f) Calculate the ve-number summary for these data. g) Given the value 2 (y y)2 = 6,377.44, calculate the sample standard deviation for these data. h) Which do you think provides a more informative summary of these data; a five number summary or the sample mean and sample standard deviation? Briey explain your answer. During week twelve of the 2009 season the points scored by a different random sample of 30 Division I-A Football teams was also recorded. 0n the next page is JMP output for the distribution of scores for the week twelve. i) Describe the distribution of scores for the week twelve. Make sure you mention the shape, center, spread and any outliers or other interesting characteristics of the distribution. j) Give the value of the sample mean score. Give the value of the sample median score. What does the relationship between these two values indicate about the shape of the distribution? k) Give the value of the sample standard deviation of the scores. 1) Construct side-byside box plots (use a common scale) and use these to compare the distribution of the rst week's scores to week twelve's scores

Step by Step Solution

There are 3 Steps involved in it

Step: 1

blur-text-image

Get Instant Access to Expert-Tailored Solutions

See step-by-step solutions with expert insights and AI powered tools for academic success

Step: 2

blur-text-image

Step: 3

blur-text-image

Ace Your Homework with AI

Get the answers you need in no time with our AI-driven, step-by-step assistance

Get Started

Recommended Textbook for

Modeling the Dynamics of Life Calculus and Probability for Life Scientists

Authors: Frederick R. Adler

3rd edition

840064187, 978-1285225975, 128522597X, 978-0840064189

More Books

Students also viewed these Mathematics questions

Question

Describe the Americans with Disabilities Act.

Answered: 1 week ago

Question

Explain Promotion Mix.

Answered: 1 week ago

Question

Explain the promotional mix elements.

Answered: 1 week ago

Question

1. There are many social organisations around us?

Answered: 1 week ago

Question

Why advertising is important in promotion of a product ?

Answered: 1 week ago