

Answered step by step
Verified Expert Solution
Question
1 Approved Answer
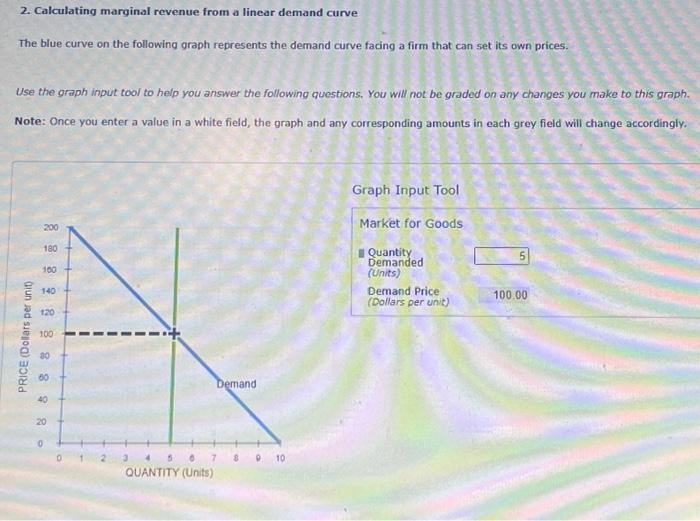
2. Calculating marginal revenue from a linear demand curve The blue curve on the following graph represents the demand curve facing a firm that can
Step by Step Solution
There are 3 Steps involved in it
Step: 1

Get Instant Access to Expert-Tailored Solutions
See step-by-step solutions with expert insights and AI powered tools for academic success
Step: 2

Step: 3
Ace Your Homework with AI
Get the answers you need in no time with our AI-driven, step-by-step assistance
Get Started
Loss Control Auditing A Guide For Conducting Fire Safety And Security Audits
Authors: E. Scott Dunlap
2nd Edition
103244293X, 978-1032442938