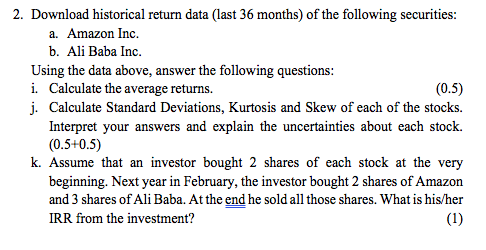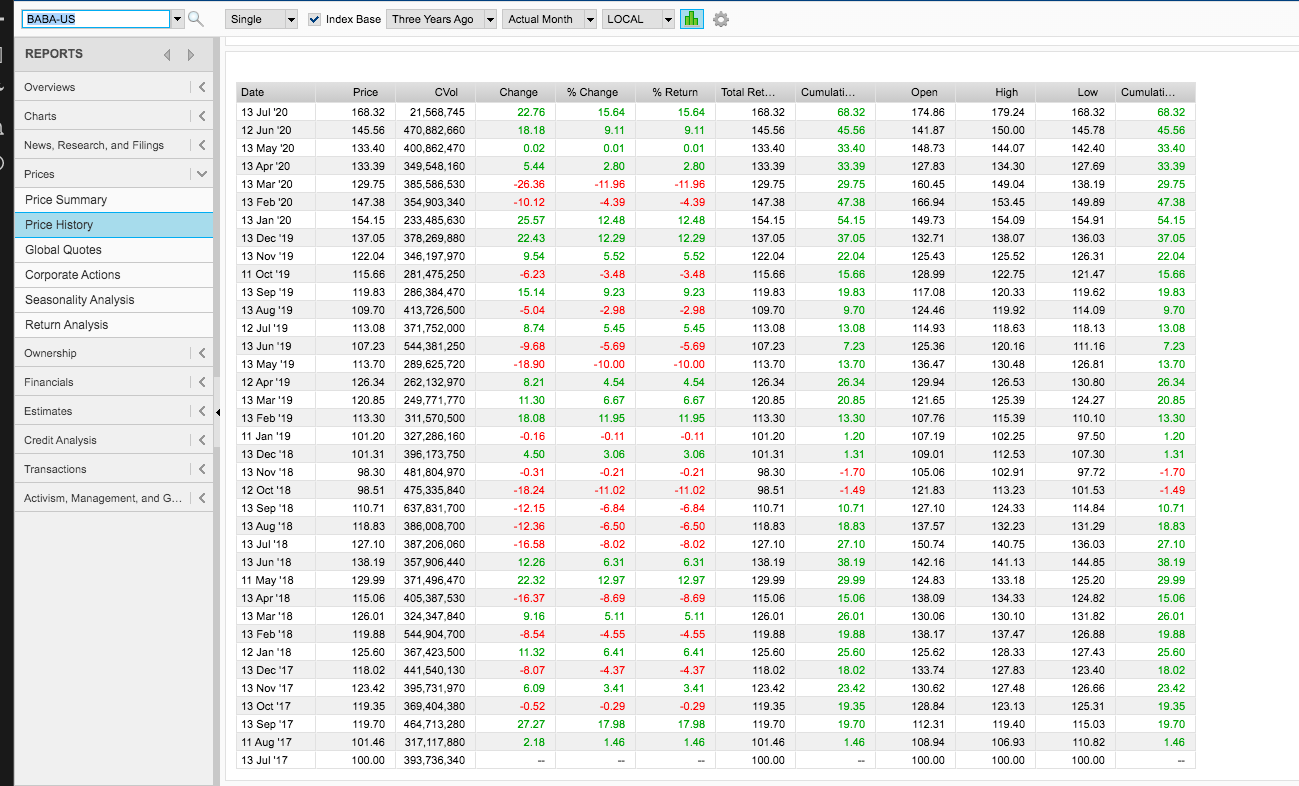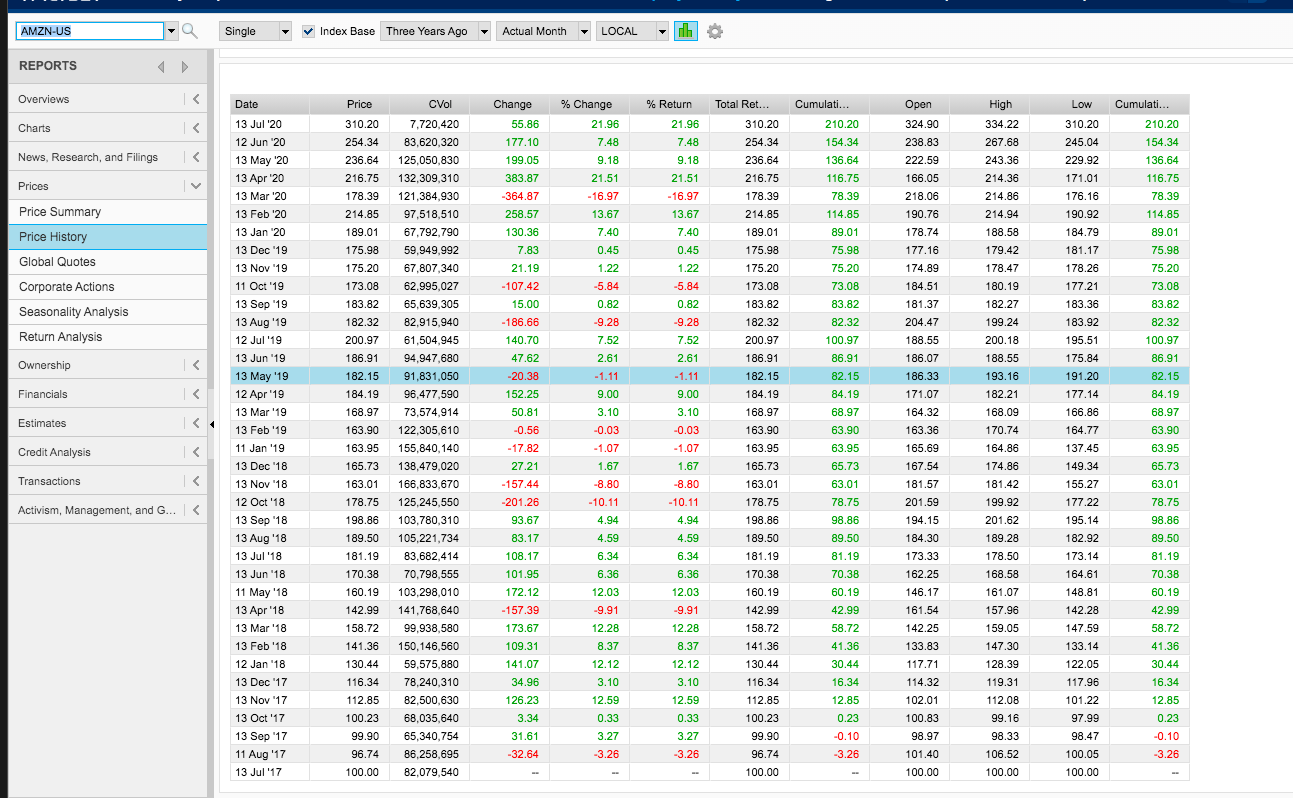


2. Download historical return data (last 36 months) of the following securities: a. Amazon Inc. b. Ali Baba Inc. Using the data above, answer the following questions: i. Calculate the average returns. (0.5) j. Calculate Standard Deviations, Kurtosis and Skew of each of the stocks. Interpret your answers and explain the uncertainties about each stock. (0.5+0.5) k. Assume that an investor bought 2 shares of each stock at the very beginning. Next year in February, the investor bought 2 shares of Amazon and 3 shares of Ali Baba. At the end he sold all those shares. What is his/her IRR from the investment? (1) BABA-US Single Index Base Three Years Ago Actual Month LOCAL dh REPORTS Overviews Price Total Ret... Cumulati... Low 168.32 Charts % Change 15.64 9.11 68.32 Change 22.76 18.18 0.02 High 179.24 150.00 144.07 168.32 145.56 133.40 133.39 129.75 45.56 News, Research, and Filings 145.78 142.40 0.01 Prices % Return 15.64 9.11 0.01 2.80 - 11.96 -4.39 12.48 12.29 5.52 33.40 33.39 29.75 134.30 149.04 Cumulati... 68.32 45.56 33.40 33.39 29.75 47.38 54.15 37.05 22.04 15.66 5.44 -26.36 - 10.12 25.57 22.43 9.54 2.80 - 11.96 -4.39 12.48 12.29 Open 174.86 141.87 148.73 127.83 160.45 166.94 149.73 132.71 125.43 128.99 Price Summary 168.32 145.56 133,40 133.39 129.75 147.38 154.15 137.05 122.04 115.66 Price History 147.38 154.15 137.05 122.04 115.66 119.83 109.70 153.45 154.09 138.07 125.52 122.75 127.69 138.19 149.89 154.91 136.03 126.31 121.47 Global Quotes 5.52 Date 13 Jul 20 12 Jun 20 13 May 20 13 Apr 20 13 Mar 20 13 Feb '20 13 Jan 20 13 Dec '19 13 Nov 19 11 Oct19 13 Sep 19 13 Aug '19 12 Jul '19 13 Jun '19 13 May '19 12 Apr '19 13 Mar '19 13 Feb '19 11 Jan '19 13 Dec '18 13 Nov '18 Corporate Actions Seasonality Analysis -6.23 15.14 -5.04 8.74 -9.68 -3.48 9.23 -2.98 5.45 -3.48 9.23 -2.98 5.45 19.83 9.70 117.08 124.46 119.62 114.09 47.38 54.15 37.05 22.04 15.66 19.83 9.70 13.08 7.23 13.70 26.34 Return Analysis 118.13 111.16 Ownership -5.69 - 10.00 4.54 - 18.90 114.93 125.36 136.47 129.94 -5.69 -10.00 4.54 Financials 8.21 11.30 18.08 20.85 113.08 107.23 113.70 126.34 120.85 113.30 101.20 101.31 98.30 98.51 Estimates CVol 21,568,745 470,882,660 400,862,470 349,548,160 385,586,530 354,903,340 233,485,630 378,269.880 346, 197,970 281,475,250 286,384,470 413,726,500 371,752,000 544,381,250 289,625,720 262,132,970 249,771,770 311,570,500 327,286,160 396,173,750 481,804,970 475.335,840 637,831,700 386,008,700 387,206,060 357,906,440 371,496,470 405,387,530 324,347,840 544,904,700 367,423,500 441,540,130 395,731,970 369,404,380 464,713,280 317,117,880 393,736,340 121.65 107.76 6.67 11.95 -0.11 3.06 119.83 109.70 113.08 107.23 113.70 126.34 120.85 113.30 101.20 101.31 98.30 98.51 110.71 118.83 127.10 Credit Analysis 120.33 119.92 118.63 120.16 130.48 126.53 125.39 115.39 102.25 112.53 102.91 113.23 124.33 132.23 140.75 107.19 -0.16 4.50 13.30 1.20 1.31 -1.70 -1.49 Transactions 13.08 7.23 13.70 26.34 20.85 13.30 1.20 1.31 -1.70 -1.49 10.71 18.83 27.10 38.19 29.99 15.06 26.01 19.88 126.81 130.80 124.27 110.10 97.50 107.30 97.72 101.53 114.84 131.29 136.03 Activism, Management, and G... 110.71 10.71 6.67 11.95 -0.11 3.06 -0.21 -11.02 -6.84 -6.50 -8.02 6.31 12.97 -8.69 5.11 -4.55 6.41 12 Oct '18 13 Sep '18 13 Aug '18 13 Jul '18 13 Jun '18 11 May '18 13 Apr '18 13 Mar '18 -0.31 - 18.24 -12.15 - 12.36 - 16.58 12.26 22.32 - 16.37 -0.21 -11.02 -6.84 -6.50 -8.02 6.31 12.97 -8.69 5.11 -4.55 118.83 127.10 138.19 129.99 115.06 126.01 109.01 105.06 121.83 127.10 137.57 150.74 142.16 124.83 138.09 130.06 138.17 144.85 141.13 133.18 134.33 130.10 125.20 124.82 131.82 18.83 27.10 38.19 29.99 15.06 26.01 19.88 13 Feb '18 119.88 138.19 129.99 115.06 126.01 119.88 125.60 118.02 123.42 119.35 9.16 -8.54 11.32 126.88 6.41 12 Jan '18 13 Dec '17 127.43 25.60 18.02 137.47 128.33 127.83 125.62 133.74 25.60 18.02 -8.07 6.09 -4.37 3.41 -4.37 3.41 13 Nov '17 13 Oct '17 125.60 118.02 123.42 119.35 119.70 101.46 100.00 23.42 19.35 130.62 128.84 -0.52 27.27 2.18 -0.29 17.98 1.46 127.48 123.13 119.40 106.93 -0.29 17.98 1.46 13 Sep '17 11 Aug '17 13 Jul '17 123.40 126.66 125.31 115.03 110.82 23.42 19.35 19.70 1.46 119.70 101.46 100.00 19.70 1.46 112.31 108.94 100.00 100.00 100.00 AMZN-US Single Index Base Three Years Ago Actual Month LOCAL nh REPORTS Overviews % Change Total Ret... Low Charts 15 21.96 7.48 % Return 21.96 7.48 High 334.22 267.68 310.20 245.04 Price 310.20 254.34 236.64 216.75 178.39 Change 55.86 177.10 199.05 383.87 -364.87 |


