

Answered step by step
Verified Expert Solution
Question
1 Approved Answer
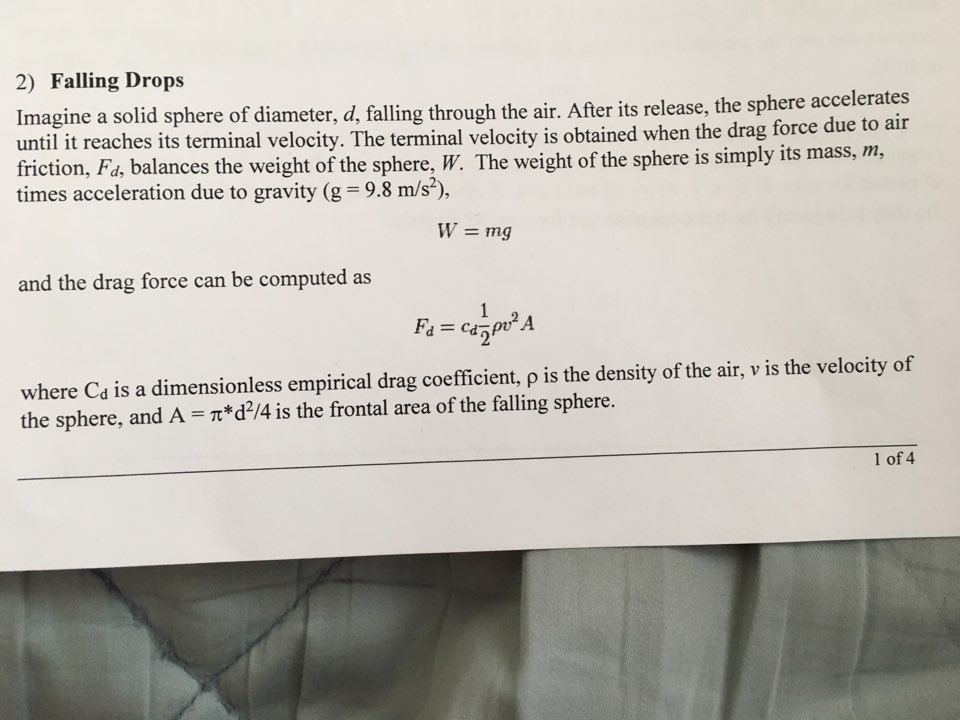
2) Falling Drops Imagine a solid sphere of d friction, Fd, balances the weight of the sphere, W. The weight of the sphere is simply
Step by Step Solution
There are 3 Steps involved in it
Step: 1

Get Instant Access to Expert-Tailored Solutions
See step-by-step solutions with expert insights and AI powered tools for academic success
Step: 2

Step: 3
Ace Your Homework with AI
Get the answers you need in no time with our AI-driven, step-by-step assistance
Get Started
Machine Learning And Knowledge Discovery In Databases European Conference Ecml Pkdd 2010 Barcelona Spain September 2010 Proceedings Part 1 Lnai 6321
Authors: Jose L. Balcazar ,Francesco Bonchi ,Aristides Gionis ,Michele Sebag
2010th Edition