

Answered step by step
Verified Expert Solution
Question
1 Approved Answer
2 . ) Here is a graph of the last month of Toyota stock prices, with some smoothing done by hand. MOME > TM -
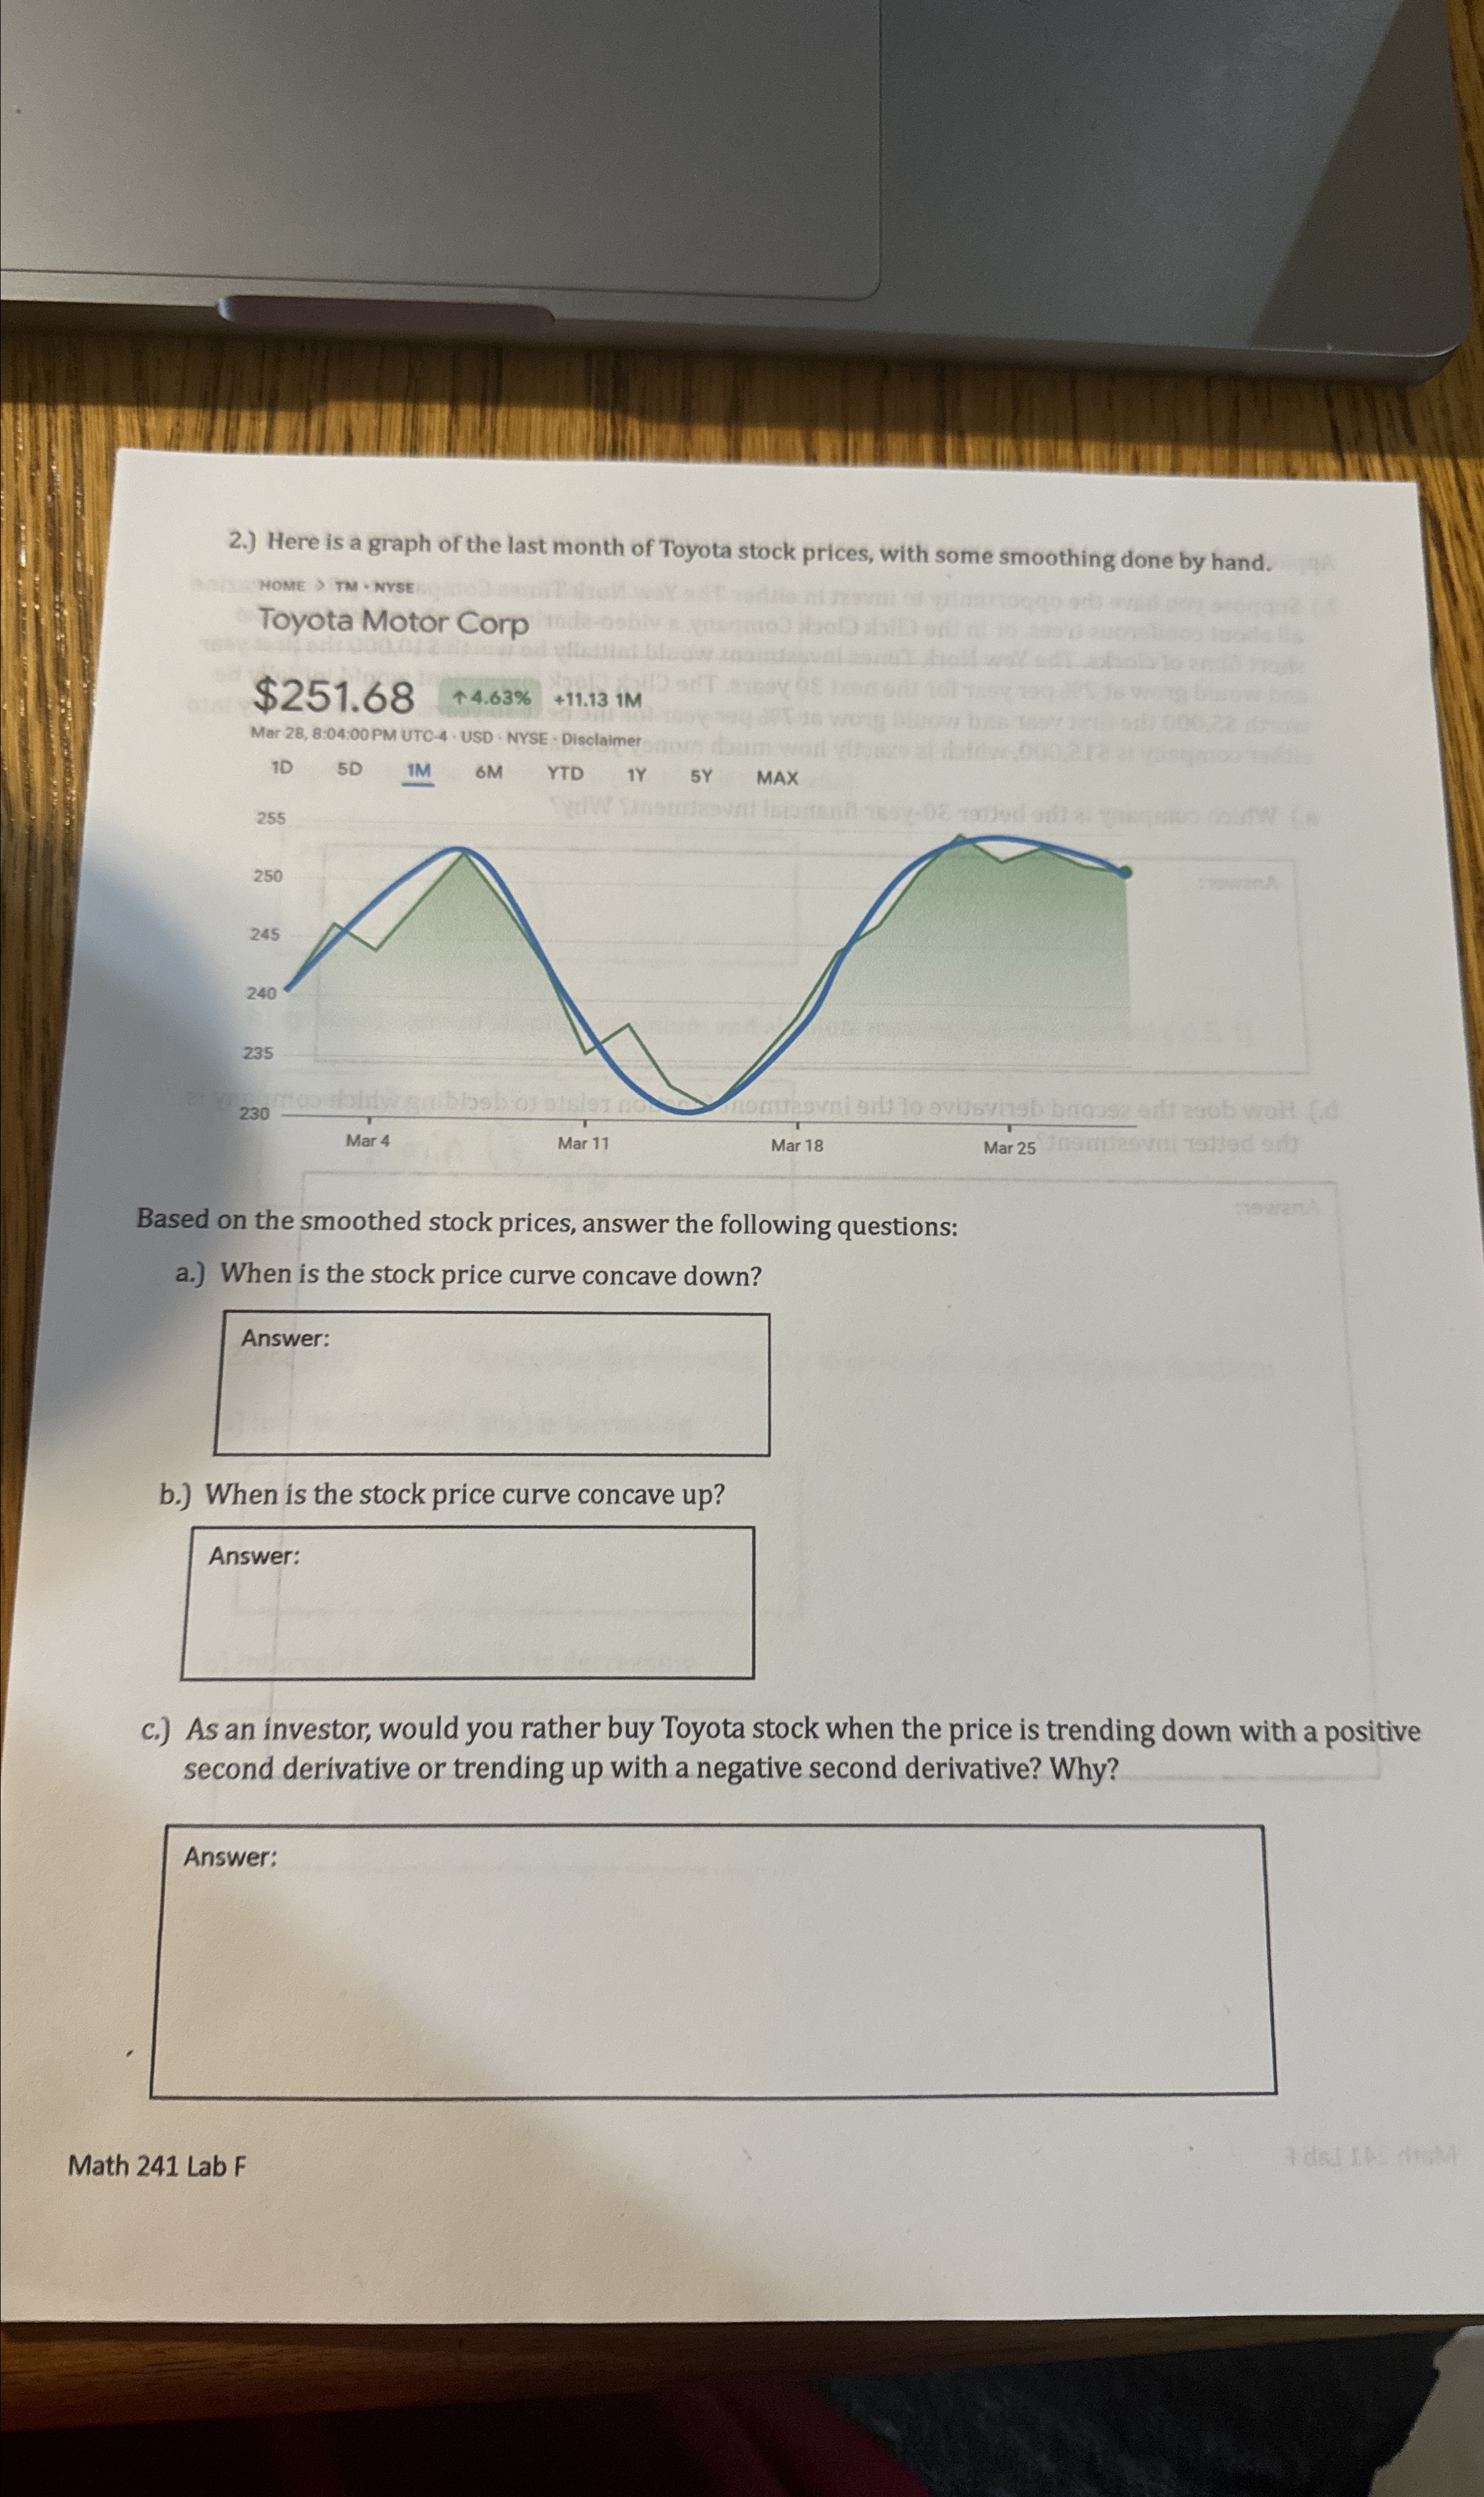
Here is a graph of the last month of Toyota stock prices, with some smoothing done by hand.
MOME TM NYSE
Toyota Motor Corp
$
Mar :: PM UTC USD NYSE Disclaimer
Based on the smoothed stock prices, answer the following questions:
a When is the stock price curve concave down?
b When is the stock price curve concave up
c As an investor, would you rather buy Toyota stock when the price is trending down with a positive second derivative or trending up with a negative second derivative? Why?
Math Lab F
Zdes la dtak
Step by Step Solution
There are 3 Steps involved in it
Step: 1

Get Instant Access to Expert-Tailored Solutions
See step-by-step solutions with expert insights and AI powered tools for academic success
Step: 2

Step: 3
Ace Your Homework with AI
Get the answers you need in no time with our AI-driven, step-by-step assistance
Get Started
Chains Of Finance How Investment Management Is Shaped
Authors: Diane-Laure Arjalies, Philip Grant, Iain Hardie, Donald MacKenzie, Ekaterina Svetlova
1st Edition
0198802943, 978-0198802945