

Answered step by step
Verified Expert Solution
Question
1 Approved Answer
2. In the light of the table below, Interpret the following results and make a comparison among all financial institutions. [Marks 10] Results of Regressions
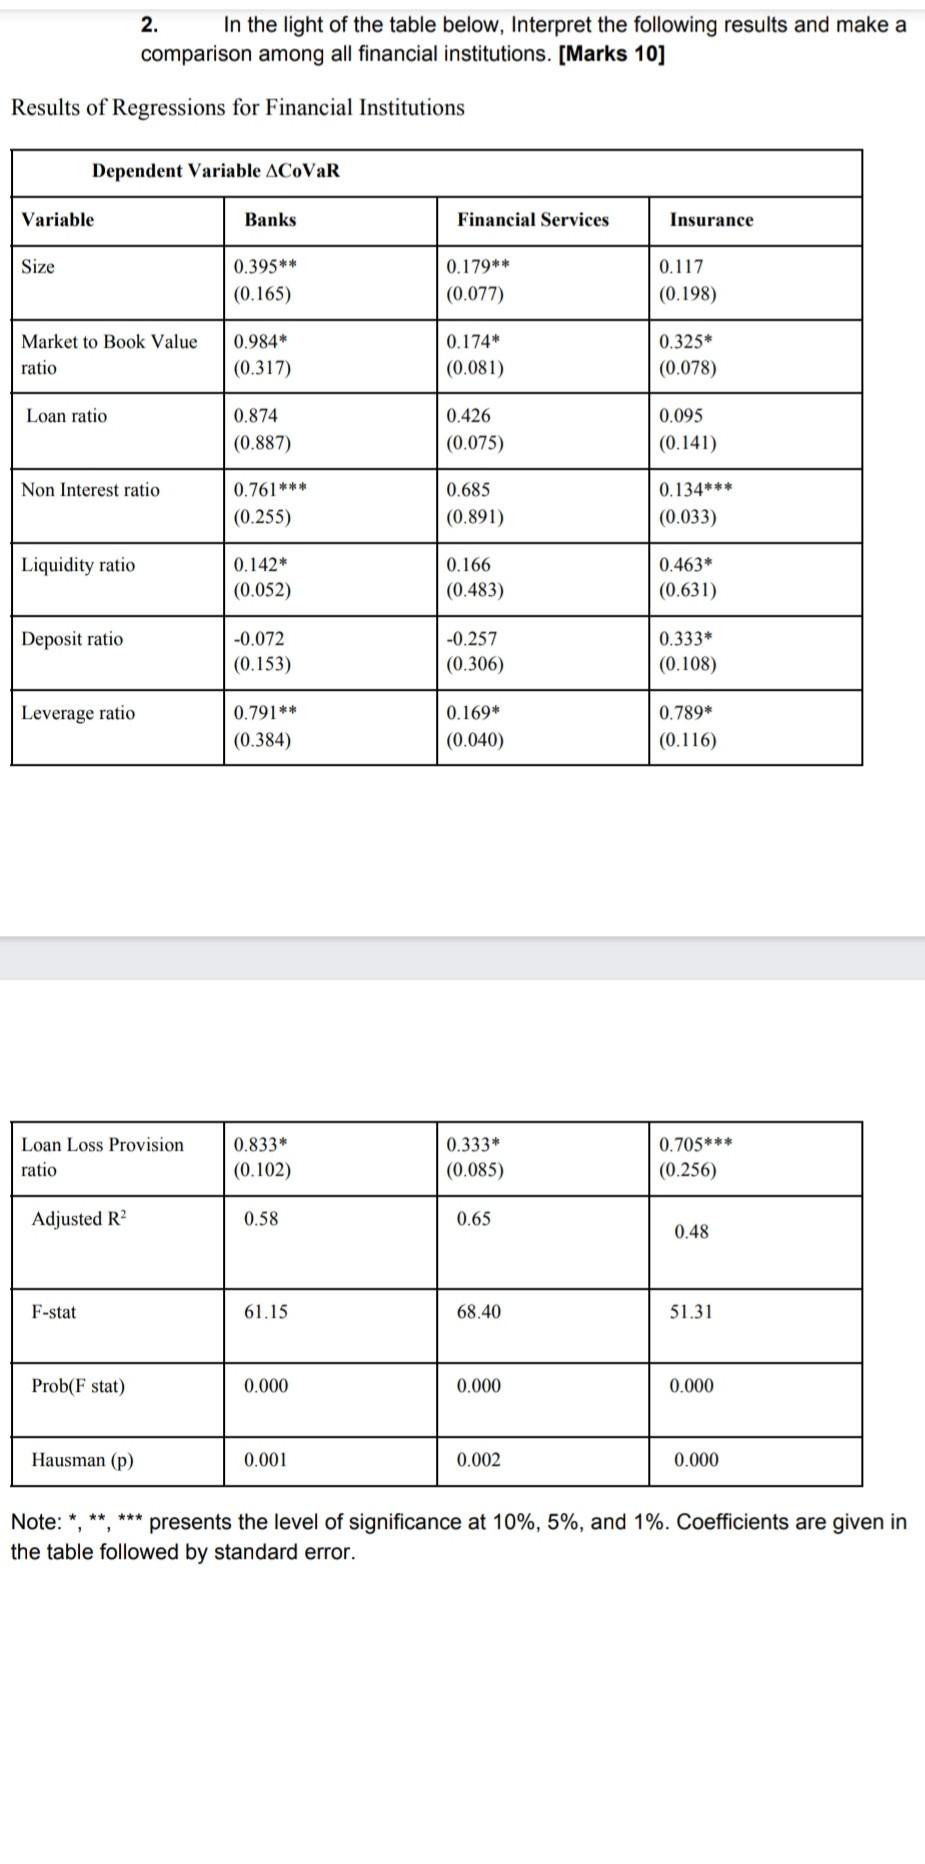
2. In the light of the table below, Interpret the following results and make a comparison among all financial institutions. [Marks 10] Results of Regressions for Financial Institutions Dependent Variable ACoVaR Variable Banks Financial Services Insurance Size 0.395** 0.179** (0.077) 0.117 (0.198) (0.165) Market to Book Value ratio 0.984* (0.317) 0.174* (0.081) 0.325* (0.078) Loan ratio 0.874 (0.887) 0.426 (0.075) 0.095 (0.141) Non Interest ratio 0.761*** (0.255) 0.685 (0.891) 0.134*** (0.033) Liquidity ratio 0.142* (0.052) 0.166 (0.483) 0.463* (0.631) Deposit ratio -0.072 (0.153) -0.257 (0.306) 0.333* (0.108) Leverage ratio 0.791** (0.384) 0.169* (0.040) 0.789* (0.116) Loan Loss Provision ratio 0.833* (0.102) 0.333* (0.085) 0.705*** (0.256) Adjusted R2 0.58 0.65 0.48 F-stat 61.15 68.40 51.31 Prob(F stat) 0.000 0.000 0.000 Hausman (p) 0.001 0.002 0.000 Note: *, **, *** presents the level of significance at 10%, 5%, and 1%. Coefficients are given in the table followed by standard error. 2. In the light of the table below, Interpret the following results and make a comparison among all financial institutions. [Marks 10] Results of Regressions for Financial Institutions Dependent Variable ACoVaR Variable Banks Financial Services Insurance Size 0.395** 0.179** (0.077) 0.117 (0.198) (0.165) Market to Book Value ratio 0.984* (0.317) 0.174* (0.081) 0.325* (0.078) Loan ratio 0.874 (0.887) 0.426 (0.075) 0.095 (0.141) Non Interest ratio 0.761*** (0.255) 0.685 (0.891) 0.134*** (0.033) Liquidity ratio 0.142* (0.052) 0.166 (0.483) 0.463* (0.631) Deposit ratio -0.072 (0.153) -0.257 (0.306) 0.333* (0.108) Leverage ratio 0.791** (0.384) 0.169* (0.040) 0.789* (0.116) Loan Loss Provision ratio 0.833* (0.102) 0.333* (0.085) 0.705*** (0.256) Adjusted R2 0.58 0.65 0.48 F-stat 61.15 68.40 51.31 Prob(F stat) 0.000 0.000 0.000 Hausman (p) 0.001 0.002 0.000 Note: *, **, *** presents the level of significance at 10%, 5%, and 1%. Coefficients are given in the table followed by standard error
Step by Step Solution
There are 3 Steps involved in it
Step: 1

Get Instant Access to Expert-Tailored Solutions
See step-by-step solutions with expert insights and AI powered tools for academic success
Step: 2

Step: 3
Ace Your Homework with AI
Get the answers you need in no time with our AI-driven, step-by-step assistance
Get Started
Handbook Of Recent Advances In Commodity And Financial Modeling
Authors: Giorgio Consigli, Silvana Stefani, Giovanni Zambruno
1st Edition
3319613189, 978-3319613185