

Answered step by step
Verified Expert Solution
Question
1 Approved Answer
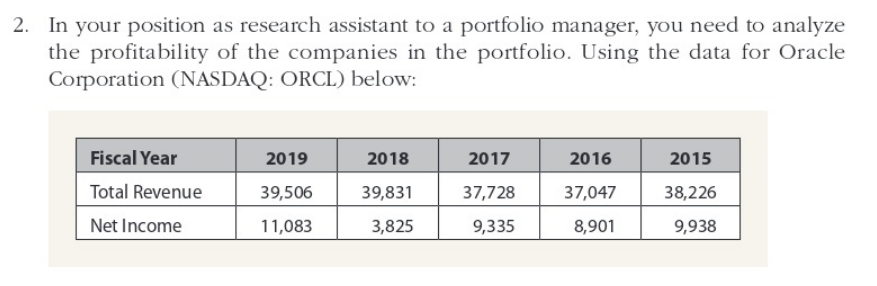
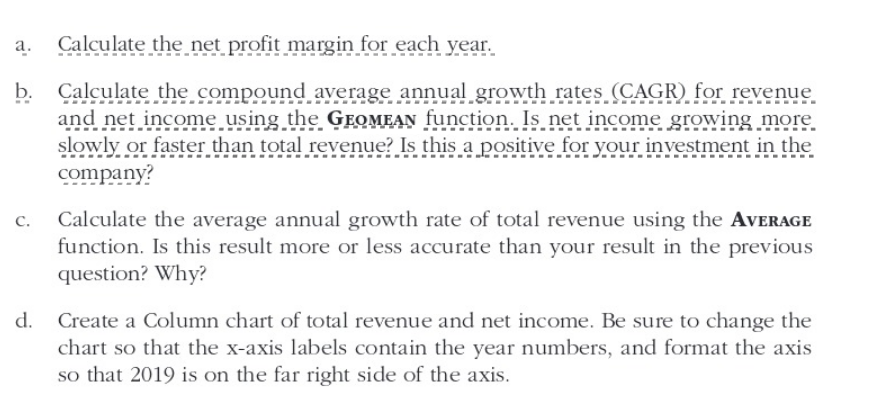
2. In your position as research assistant to a portfolio manager, you need to analyze the profitability of the companies in the portfolio. Using the
Step by Step Solution
There are 3 Steps involved in it
Step: 1

Get Instant Access to Expert-Tailored Solutions
See step-by-step solutions with expert insights and AI powered tools for academic success
Step: 2

Step: 3
Ace Your Homework with AI
Get the answers you need in no time with our AI-driven, step-by-step assistance
Get Started
Basic Finance An Introduction To Financial Institutions, Investments, And Management
Authors: Herbert B. Mayo
12th Edition
1337691011, 978-1337691017