

Answered step by step
Verified Expert Solution
Question
1 Approved Answer
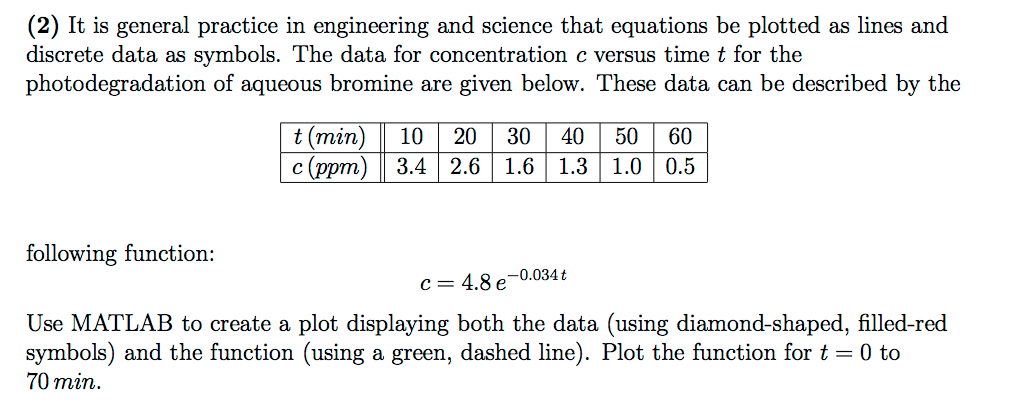
(2) It is general practice in engineering and science that equations be plotted as lines and photodegradation of aqueous bromine are given below. These data
Step by Step Solution
There are 3 Steps involved in it
Step: 1

Get Instant Access to Expert-Tailored Solutions
See step-by-step solutions with expert insights and AI powered tools for academic success
Step: 2

Step: 3
Ace Your Homework with AI
Get the answers you need in no time with our AI-driven, step-by-step assistance
Get Started
Performing With Computer Applications Personal Information Manager Word Processing Desktop Publishing Spreadsheets Databases Presentations Assessment Manager
Authors: Iris Blanc
3rd Edition
141886515X, 978-1418865153