Answered step by step
Verified Expert Solution
Link Copied!

Question

1 Approved Answer

2. On the graph below, the shift of the supply curve from S1 to $2 represents the imposition of a tax on a good. On
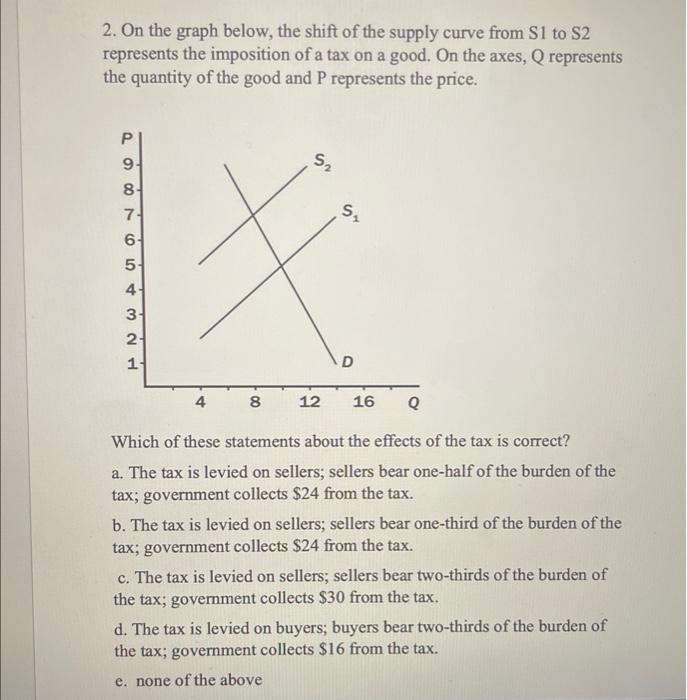
image text in transcribed
2. On the graph below, the shift of the supply curve from S1 to $2 represents the imposition of a tax on a good. On the axes, Q represents the quantity of the good and P represents the price. 91 H N WA UI Q N OO 6 0 8 12 16 Which of these statements about the effects of the tax is correct? a. The tax is levied on sellers; sellers bear one-half of the burden of the tax; government collects $24 from the tax. b. The tax is levied on sellers; sellers bear one-third of the burden of the tax; government collects $24 from the tax. c. The tax is levied on sellers; sellers bear two-thirds of the burden of the tax; government collects $30 from the tax. d. The tax is levied on buyers; buyers bear two-thirds of the burden of the tax; government collects $16 from the tax. e. none of the above

Step by Step Solution

There are 3 Steps involved in it

Step: 1

blur-text-image

Get Instant Access to Expert-Tailored Solutions

See step-by-step solutions with expert insights and AI powered tools for academic success

Step: 2

blur-text-image

Step: 3

blur-text-image

Ace Your Homework with AI

Get the answers you need in no time with our AI-driven, step-by-step assistance

Get Started

Recommended Textbook for

Managerial Economics A Problem-Solving Approach

Authors: Luke M. Froeb, Brain T. Mccann

2nd Edition

B00BTM8FK0

More Books

Students also viewed these Economics questions

Question

=+ e. What happens to Oceanias real exchange rate?

Answered: 1 week ago