Answered step by step
Verified Expert Solution
Question
1 Approved Answer
2 Problem 17-1A Calculation and analysis of trend percents LO A1, P1 Selected comparative financial statements of Haroun Company follow Comparative Income Statements For Years
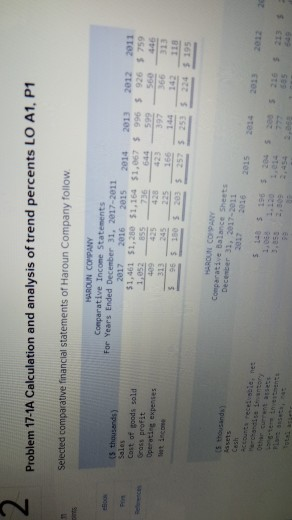
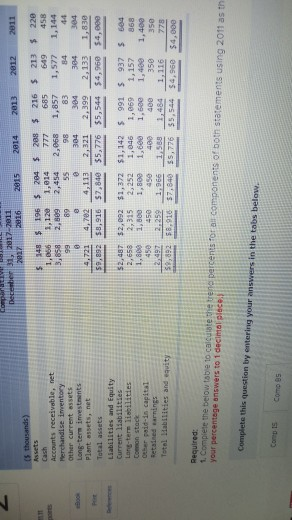
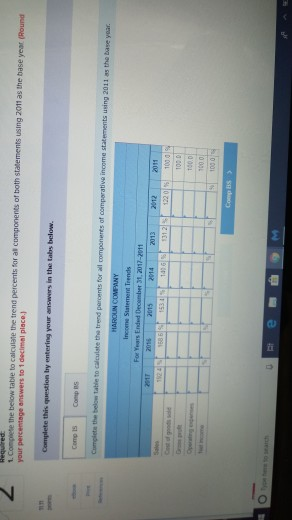
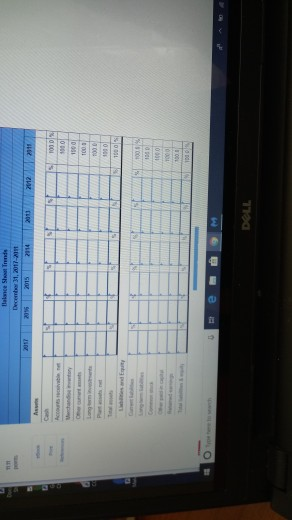
2 Problem 17-1A Calculation and analysis of trend percents LO A1, P1 Selected comparative financial statements of Haroun Company follow Comparative Income Statements For Years Ended December 31, 2017-2011 2017 2016 2e15 2014 2013 2012 2013 $1,461 51,280 51,164 51,067 $ 996$ 926 $ 759 thousands) Cost of goods sold Gross profit 499 425 423 397 366 313 166 96 December 31, 2017-2011 2017 2016 2015 2014 2033 2012 348 196 $ 204 S 288 216 1,066 1,12 1,814 777 685 3,858 213 220 458 2,809 2,454 2,068 1,857 1,577 1,144 304 304 304 364 649 Accounts receivable, net Other current essets Plant assets, net imentory 98 83 89 721 4.782 41113- 2,321 2,099 2, 133 1,830 $9,892 $8,916 $7,840 $5,776 $5,544 $4,960 $4,eee Liabilities and Equity Current 11abi11ties 2,487 $2,092 $1,372 $1,142 s 991 937 s 604 2,658 2,315 2,252 1,046 1,869 1,157 868 1,800 1,800 1,800 1,600 1,680 1,4 1,400 term liebilities Coemon stack other paid-in capitaL Retained earnings 450 45045e 2 487 2.259 1,966 1,588 ,484116 400 350 5892 58.916 $7,848 $5,776 $5,544 $4,96e $4,000 Required 1. Complete the below tabie to calcuiate the your percentage answers to 1 decimol plece. t ai components of both statements using 2011 as th Complete this question by entering your answers in the tabs below. answers to 1 declmal place. by
Step by Step Solution
There are 3 Steps involved in it
Step: 1

Get Instant Access to Expert-Tailored Solutions
See step-by-step solutions with expert insights and AI powered tools for academic success
Step: 2

Step: 3

Ace Your Homework with AI
Get the answers you need in no time with our AI-driven, step-by-step assistance
Get Started


