

Answered step by step
Verified Expert Solution
Question
1 Approved Answer
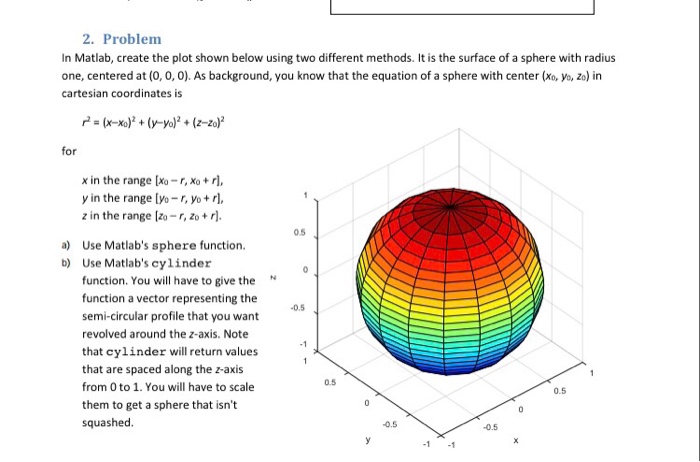
2. Problem In Matlab, create the plot shown below using two different methods. It is the surface of a sphere with radius one, centered at
Step by Step Solution
There are 3 Steps involved in it
Step: 1

Get Instant Access to Expert-Tailored Solutions
See step-by-step solutions with expert insights and AI powered tools for academic success
Step: 2

Step: 3
Ace Your Homework with AI
Get the answers you need in no time with our AI-driven, step-by-step assistance
Get Started
Semantics In Databases Second International Workshop Dagstuhl Castle Germany January 2001 Revised Papers Lncs 2582
Authors: Leopoldo Bertossi ,Gyula O.H. Katona ,Klaus-Dieter Schewe ,Bernhard Thalheim
2003rd Edition
3540009574, 978-3540009573