Answered step by step
Verified Expert Solution
Link Copied!

Question

1 Approved Answer

2. Problem In Matlab, create the plot shown below using two different methods. It is the surface of a sphere with radius one, centered at
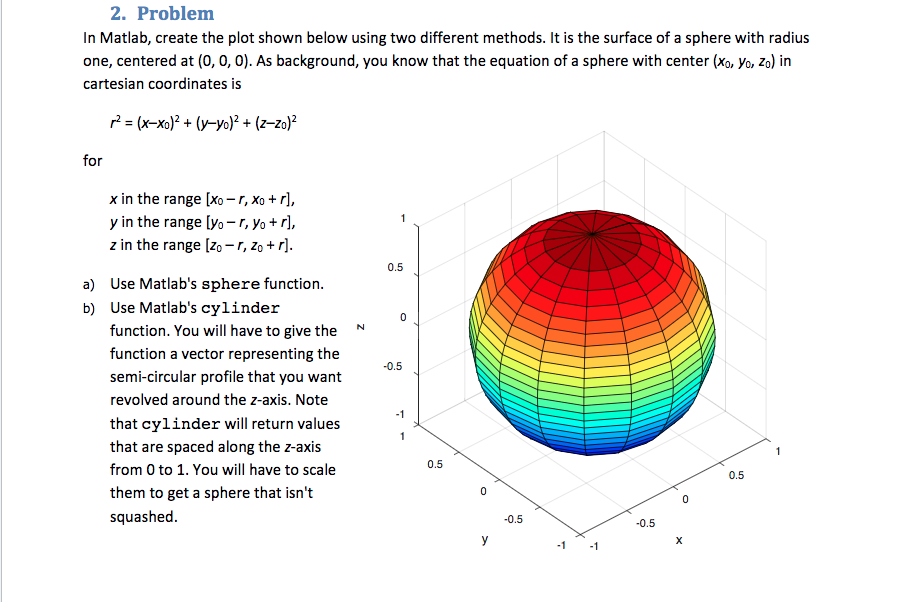
image text in transcribed

2. Problem In Matlab, create the plot shown below using two different methods. It is the surface of a sphere with radius one, centered at (0, 0, 0). As background, you know that the equation of a sphere with center (xo, Yo, Zo) in cartesian coordinates is r' = (x-xo)2 + (y-yo)2 + (z-zo)2 for x in the range [Xo -r, Xo +rl, y in the range lvo-r, Vo+ r], z in the range [zo-r, Zo + r] 0.5 Use Matlab's sphere function Use Matlab's cylinder function. You will have to give the function a vector representing the semi-circular profile that you want revolved around the z-axis. Note that cylinder will return values that are spaced along the z-axis from 0 to 1. You will have to scale them to get a sphere that isn't squashed a) b) N 0.5 0.5 0.5 0.5 0.5

Step by Step Solution

There are 3 Steps involved in it

Step: 1

blur-text-image

Get Instant Access to Expert-Tailored Solutions

See step-by-step solutions with expert insights and AI powered tools for academic success

Step: 2

blur-text-image

Step: 3

blur-text-image

Ace Your Homework with AI

Get the answers you need in no time with our AI-driven, step-by-step assistance

Get Started

Recommended Textbook for

Learning MySQL Get A Handle On Your Data

Authors: Seyed M M Tahaghoghi

1st Edition

0596529465, 9780596529468

More Books

Students also viewed these Databases questions