

Answered step by step
Verified Expert Solution
Question
1 Approved Answer
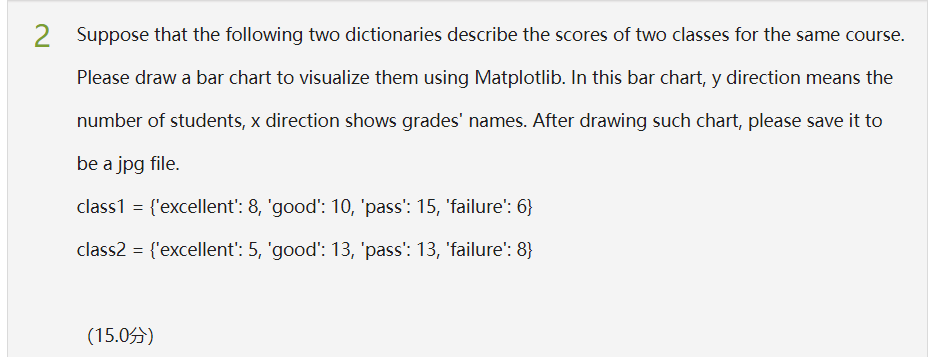
2 Suppose that the following two dictionaries describe the scores of two classes for the same course. Please draw a bar chart to visualize them

Step by Step Solution
There are 3 Steps involved in it
Step: 1

Get Instant Access to Expert-Tailored Solutions
See step-by-step solutions with expert insights and AI powered tools for academic success
Step: 2

Step: 3
Ace Your Homework with AI
Get the answers you need in no time with our AI-driven, step-by-step assistance
Get Started
DATABASE Administrator Make A Difference
Authors: Mohciine Elmourabit
1st Edition
B0CGM7XG75, 978-1722657802