

Question
2) Table shows the density (p) of N_2 as a function of pressure (P) at T=200 K. 6.0 14.0 17.0 0.3825 0.9685 1.2257 P
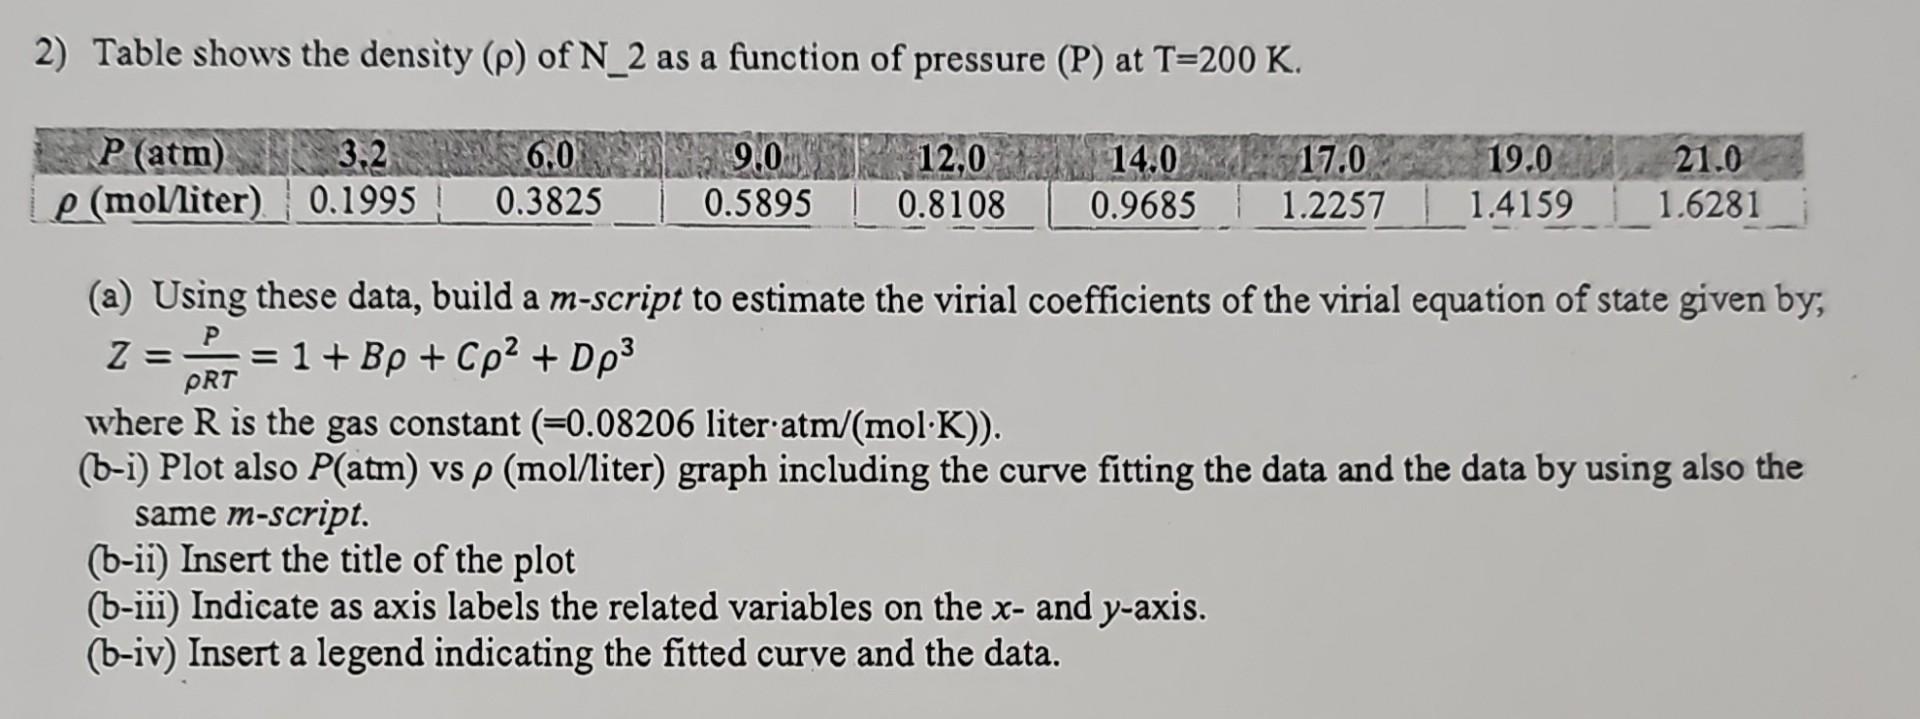
2) Table shows the density (p) of N_2 as a function of pressure (P) at T=200 K. 6.0 14.0 17.0 0.3825 0.9685 1.2257 P (atm) p (mol/liter) 3,2 0.1995 9.0 0.5895 12,0 0.8108 19.0 1.4159 21.0 1.6281 (a) Using these data, build a m-script to estimate the virial coefficients of the virial equation of state given by, Z = = 1 + Bp + Cp + Dp (b-iii) Indicate as axis labels the related variables on the x- and y-axis. (b-iv) Insert a legend indicating the fitted curve and the data. PRT where R is the gas constant (-0.08206 liter.atm/(molK)). (b-i) Plot also P(atm) vs p (mol/liter) graph including the curve fitting the data and the data by using also the same m-script. (b-ii) Insert the title of the plot
Step by Step Solution
There are 3 Steps involved in it
Step: 1
a To estimate the virial coefficients and create the desired plot you can use MATLAB Heres an exampl...
Get Instant Access to Expert-Tailored Solutions
See step-by-step solutions with expert insights and AI powered tools for academic success
Step: 2

Step: 3
Ace Your Homework with AI
Get the answers you need in no time with our AI-driven, step-by-step assistance
Get Started
Introduction to Wireless and Mobile Systems
Authors: Dharma P. Agrawal, Qing An Zeng
4th edition
1305087135, 978-1305087132, 9781305259621, 1305259629, 9781305537910 , 978-130508713