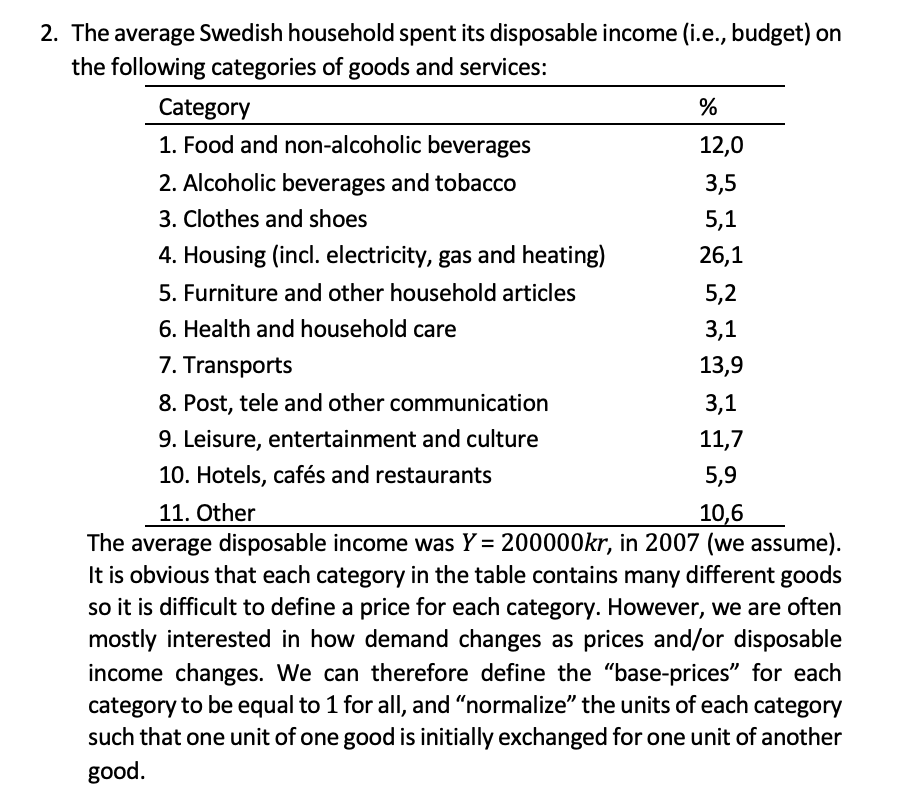
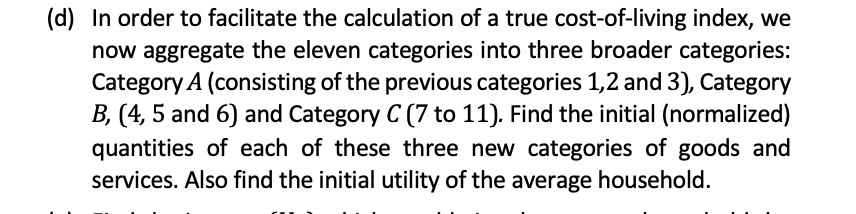
2. The average Swedish household spent its disposable income (i.e., budget) on the following categories of goods and services: Category % 1. Food and non-alcoholic beverages 12,0 2. Alcoholic beverages and tobacco 3,5 3. Clothes and shoes 5,1 4. Housing (incl. electricity, gas and heating) 26,1 5. Furniture and other household articles 5,2 6. Health and household care 3,1 7. Transports 13,9 8. Post, tele and other communication 3,1 9. Leisure, entertainment and culture 11,7 10. Hotels, cafs and restaurants 5,9 11. Other 10,6 The average disposable income was Y = 200000kr, in 2007 (we assume). It is obvious that each category in the table contains many different goods so it is difficult to define a price for each category. However, we are often mostly interested in how demand changes as prices and/or disposable income changes. We can therefore define the base-prices for each category to be equal to 1 for all, and normalize the units of each category such that one unit of one good is initially exchanged for one unit of another good. (d) In order to facilitate the calculation of a true cost-of-living index, we now aggregate the eleven categories into three broader categories: Category A (consisting of the previous categories 1,2 and 3), Category B, (4, 5 and 6) and Category C(7 to 11). Find the initial (normalized) quantities of each of these three new categories of goods and services. Also find the initial utility of the average household. 2. The average Swedish household spent its disposable income (i.e., budget) on the following categories of goods and services: Category % 1. Food and non-alcoholic beverages 12,0 2. Alcoholic beverages and tobacco 3,5 3. Clothes and shoes 5,1 4. Housing (incl. electricity, gas and heating) 26,1 5. Furniture and other household articles 5,2 6. Health and household care 3,1 7. Transports 13,9 8. Post, tele and other communication 3,1 9. Leisure, entertainment and culture 11,7 10. Hotels, cafs and restaurants 5,9 11. Other 10,6 The average disposable income was Y = 200000kr, in 2007 (we assume). It is obvious that each category in the table contains many different goods so it is difficult to define a price for each category. However, we are often mostly interested in how demand changes as prices and/or disposable income changes. We can therefore define the base-prices for each category to be equal to 1 for all, and normalize the units of each category such that one unit of one good is initially exchanged for one unit of another good. (d) In order to facilitate the calculation of a true cost-of-living index, we now aggregate the eleven categories into three broader categories: Category A (consisting of the previous categories 1,2 and 3), Category B, (4, 5 and 6) and Category C(7 to 11). Find the initial (normalized) quantities of each of these three new categories of goods and services. Also find the initial utility of the average household