

Answered step by step
Verified Expert Solution
Question
1 Approved Answer
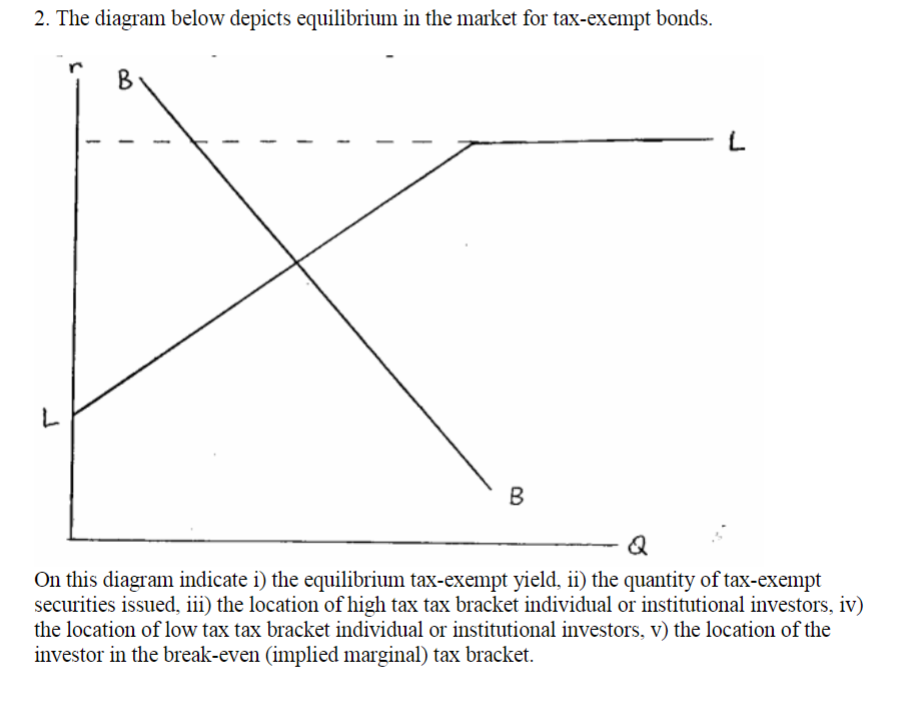
2. The diagram below depicts equilibrium in the market for tax-exempt bonds. - - - - - - - - On this diagram indicate i)
Step by Step Solution
There are 3 Steps involved in it
Step: 1

Get Instant Access to Expert-Tailored Solutions
See step-by-step solutions with expert insights and AI powered tools for academic success
Step: 2

Step: 3
Ace Your Homework with AI
Get the answers you need in no time with our AI-driven, step-by-step assistance
Get Started
Personal Finance
Authors: Jack Kapoor, Les Dlabay, Robert Hughes
10th Edition
0073530697, 9780073530697