Question
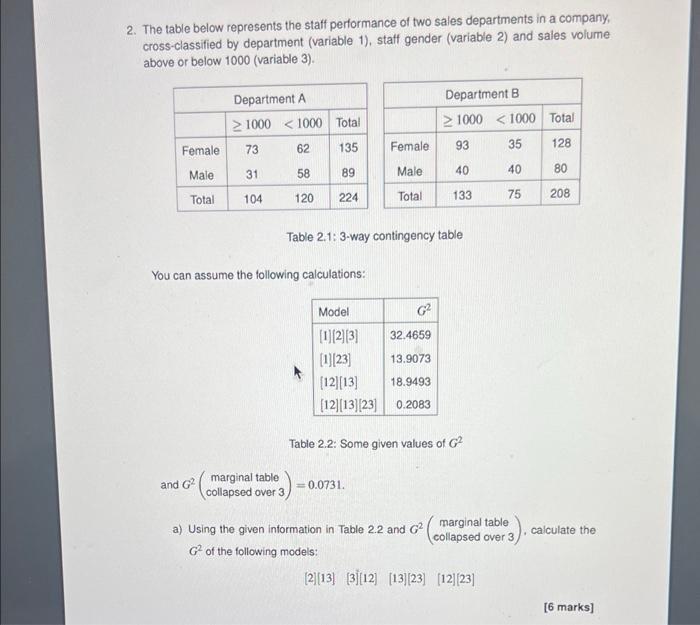
2. The table below represents the staff performance of two sales departments in a company, cross-classified by department (variable 1), staff gender (variable 2)

![b) Using a forward selection procedure, choose the best model fitting the data among the 9 hierarchical models. [5 marks] c)](https://dsd5zvtm8ll6.cloudfront.net/si.experts.images/questions/2022/05/628b8007f1539_1653309446415.jpg)
2. The table below represents the staff performance of two sales departments in a company, cross-classified by department (variable 1), staff gender (variable 2) and sales volume above or below 1000 (variable 3). Department A 1000
Step by Step Solution
3.38 Rating (157 Votes )
There are 3 Steps involved in it
Step: 1
a G202083 123123121323 324659208 01568 123123121323 189493208 00915 123132121323 139073208 00668 1231213121323 40208 00192 b The best model is the one ...
Get Instant Access to Expert-Tailored Solutions
See step-by-step solutions with expert insights and AI powered tools for academic success
Step: 2

Step: 3

Ace Your Homework with AI
Get the answers you need in no time with our AI-driven, step-by-step assistance
Get StartedRecommended Textbook for
Core Macroeconomics
Authors: Eric Chiang
3rd edition
978-1429278478, 1429278471, 978-1429278492, 1429278498, 1464191433, 978-1464191435
Students also viewed these Accounting questions
Question
Answered: 1 week ago
Question
Answered: 1 week ago
Question
Answered: 1 week ago
Question
Answered: 1 week ago
Question
Answered: 1 week ago
Question
Answered: 1 week ago
Question
Answered: 1 week ago
Question
Answered: 1 week ago
Question
Answered: 1 week ago
Question
Answered: 1 week ago
Question
Answered: 1 week ago
Question
Answered: 1 week ago
Question
Answered: 1 week ago
Question
Answered: 1 week ago
Question
Answered: 1 week ago
Question
Answered: 1 week ago
Question
Answered: 1 week ago
Question
Answered: 1 week ago
Question
Answered: 1 week ago
Question
Answered: 1 week ago
Question
Answered: 1 week ago
Question
Answered: 1 week ago
Question
Answered: 1 week ago
View Answer in SolutionInn App


