

Answered step by step
Verified Expert Solution
Question
1 Approved Answer
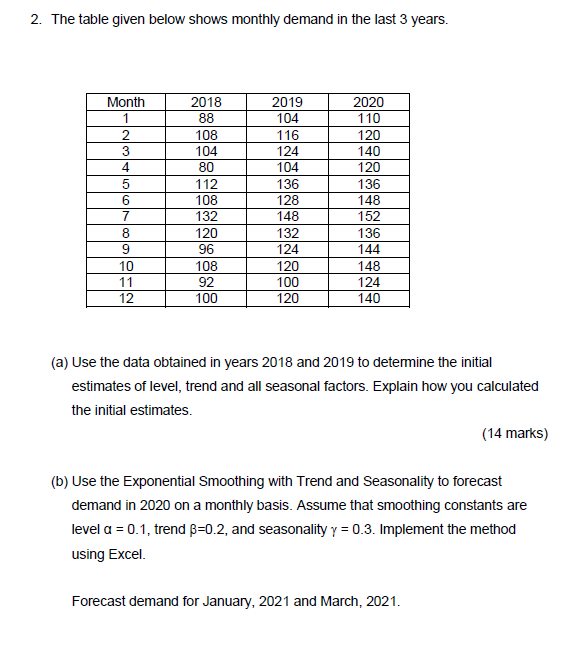
2. The table given below shows monthly demand in the last 3 years. Month 1 2 3 4 5 6 7 8 9 10 11
Step by Step Solution
There are 3 Steps involved in it
Step: 1

Get Instant Access to Expert-Tailored Solutions
See step-by-step solutions with expert insights and AI powered tools for academic success
Step: 2

Step: 3
Ace Your Homework with AI
Get the answers you need in no time with our AI-driven, step-by-step assistance
Get Started
Business Security Audit And Review Toolkit The Modern Toolkit For Security And Risk Professionals To Grow Their Business And For The Business Owners.
Authors: L Burke Files, Gamal Newry, Ibrahim Yeku
1st Edition
1674831315, 978-1674831312