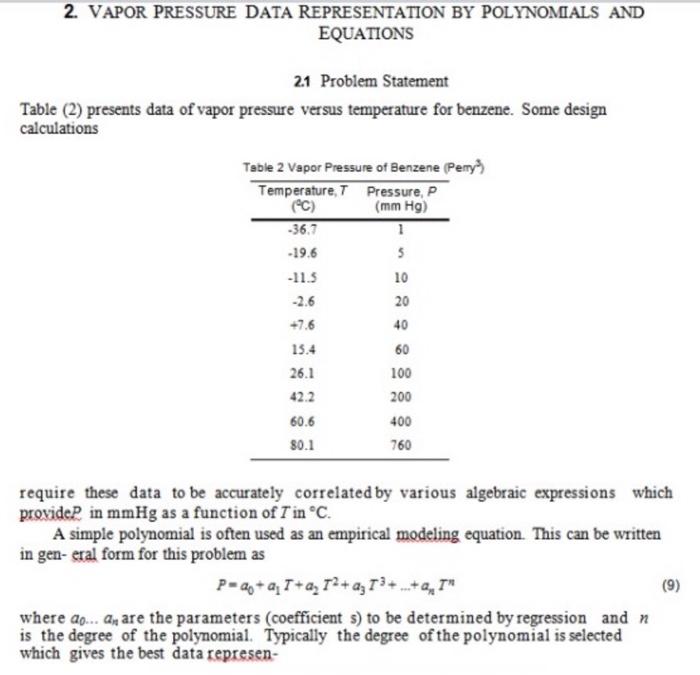
2. VAPOR PRESSURE DATA REPRESENTATION BY POLYNOMIALS AND EQUATIONS 21 Problem Statement Table (2) presents data of vapor pressure versus temperature for benzene. Some design calculations Table 2 Vapor Pressure of Benzene (Penys Temperature, T Pressure, P (C) (mm Hg) -36.7 -19.6 5 -11.5 10 -2.6 20 +7.6 40 15.4 60 26.1 100 42.2 200 60.6 400 80.1 760 require these data to be accurately correlated by various algebraic expressions which provide in mmHg as a function of T in C. A simple polynomial is often used as an empirical modeling equation. This can be written in gen-eral form for this problem as P=+aT+a, 12+az 13++, I'm (9) where ao... An are the parameters (coefficient s) to be determined by regression and n is the degree of the polynomial. Typically the degree of the polynomial is selected which gives the best data represen- tation when using a least-squares objective function. The Clausius-Clapeyron equation which is useful for the correlation of vapor pressure data is given by log(P)= 1 B T +273.15 (10) where P is the vapor pressure in mmHg and T is the temperature in C. Note that the denominator is just the absolute temperature in K. Both A and B are the parameters of the equation which are typi-cally determined by regression. The Antoine equation which is widely used for the representation of vapor pressure data is given by log(P)= 1- (11) TC where typically Pis the vapor pressure in mmHg and Tis the temperature in C. Note that this equa- tion has parameters A, B, and C which must be determined by nonlinear regression as it is not possi- ble to linearize this equation. The Antoine equation is equivalent to the Clausius- Clapeyron equation when C = 273.15. (a) Regress the data with polynomials having the form of Equation (9). Determine the degree of polynomial which best represents the data 6) Regress the data using linear regression on Equation (10), the Clausius-Clapeyron equation. Regress the data using nonlinear regression on Equation (11), the Antoine equation