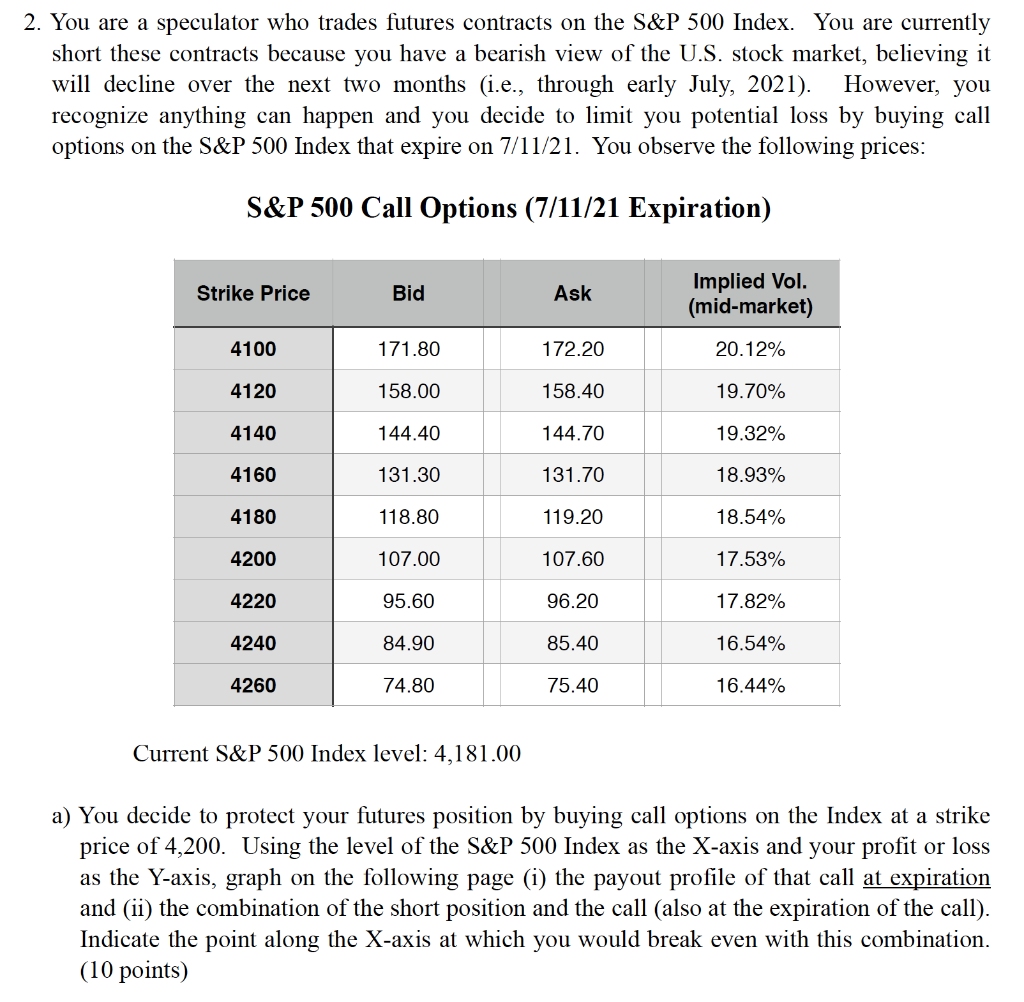

2. You are a speculator who trades futures contracts on the S&P 500 Index. You are currently short these contracts because you have a bearish view of the U.S. stock market, believing it will decline over the next two months (i.e., through early July, 2021). However, you recognize anything can happen and you decide to limit you potential loss by buying call options on the S&P 500 Index that expire on 7/11/21. You observe the following prices: S&P 500 Call Options (7/11/21 Expiration) Strike Price Bid Ask Implied Vol. (mid-market) 4100 171.80 172.20 20.12% 4120 158.00 158.40 19.70% 4140 144.40 144.70 19.32% 4160 131.30 131.70 18.93% 4180 118.80 119.20 18.54% 4200 107.00 107.60 17.53% 4220 95.60 96.20 17.82% 4240 84.90 85.40 16.54% 4260 74.80 75.40 16.44% Current S&P 500 Index level: 4,181.00 a) You decide to protect your futures position by buying call options on the Index at a strike price of 4,200. Using the level of the S&P 500 Index as the X-axis and your profit or loss as the Y-axis, graph on the following page (i) the payout profile of that call at expiration and (ii) the combination of the short position and the call (also at the expiration of the call). Indicate the point along the X-axis at which you would break even with this combination. (10 points) b) In order to subsidize the cost of the call option struck at 4,200, you decide to sell a call at 4,260. Graph the payout profile at expiration of this new combination of (i) short position plus (ii) call purchased at 4,200, and (iii) call sold at 4,260. Indicate the point along the X- axis at which you would break even with this combination. (8 points) Profit/Loss S&P 500 2. You are a speculator who trades futures contracts on the S&P 500 Index. You are currently short these contracts because you have a bearish view of the U.S. stock market, believing it will decline over the next two months (i.e., through early July, 2021). However, you recognize anything can happen and you decide to limit you potential loss by buying call options on the S&P 500 Index that expire on 7/11/21. You observe the following prices: S&P 500 Call Options (7/11/21 Expiration) Strike Price Bid Ask Implied Vol. (mid-market) 4100 171.80 172.20 20.12% 4120 158.00 158.40 19.70% 4140 144.40 144.70 19.32% 4160 131.30 131.70 18.93% 4180 118.80 119.20 18.54% 4200 107.00 107.60 17.53% 4220 95.60 96.20 17.82% 4240 84.90 85.40 16.54% 4260 74.80 75.40 16.44% Current S&P 500 Index level: 4,181.00 a) You decide to protect your futures position by buying call options on the Index at a strike price of 4,200. Using the level of the S&P 500 Index as the X-axis and your profit or loss as the Y-axis, graph on the following page (i) the payout profile of that call at expiration and (ii) the combination of the short position and the call (also at the expiration of the call). Indicate the point along the X-axis at which you would break even with this combination. (10 points) b) In order to subsidize the cost of the call option struck at 4,200, you decide to sell a call at 4,260. Graph the payout profile at expiration of this new combination of (i) short position plus (ii) call purchased at 4,200, and (iii) call sold at 4,260. Indicate the point along the X- axis at which you would break even with this combination. (8 points) Profit/Loss S&P 500


