

Answered step by step
Verified Expert Solution
Question
1 Approved Answer
(20 points) 5. A gas well was pressure tested and the data below were obtained. a. Determine (plot) the stabilized deliverability curve and calculate the
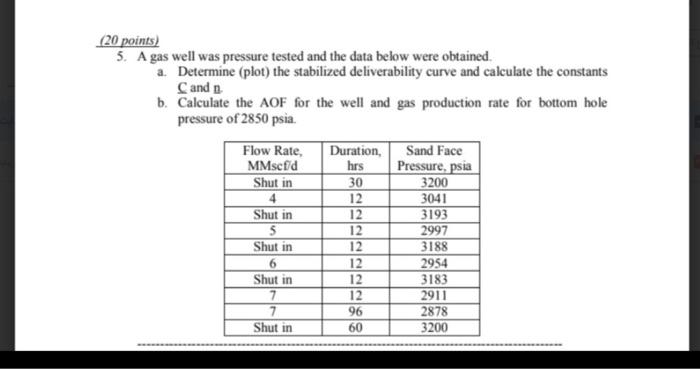
(20 points) 5. A gas well was pressure tested and the data below were obtained. a. Determine (plot) the stabilized deliverability curve and calculate the constants C and n. b. Calculate the AOF for the well and gas production rate for bottom hole pressure of 2850 psia. Flow Rate, MMscf/d Shut in 4 Shut in 5 Shut in 6 Shut in 7 7 Shut in Duration, hrs 30 12 12 12 12 12 12 12 96 60 Sand Face Pressure, psia 3200 3041 3193 2997 3188 2954 3183 2911 2878 3200
Step by Step Solution
There are 3 Steps involved in it
Step: 1

Get Instant Access to Expert-Tailored Solutions
See step-by-step solutions with expert insights and AI powered tools for academic success
Step: 2

Step: 3
Ace Your Homework with AI
Get the answers you need in no time with our AI-driven, step-by-step assistance
Get Started
Elements Of Chemical Reaction Engineering
Authors: H. Fogler
6th Edition
013548622X, 978-0135486221