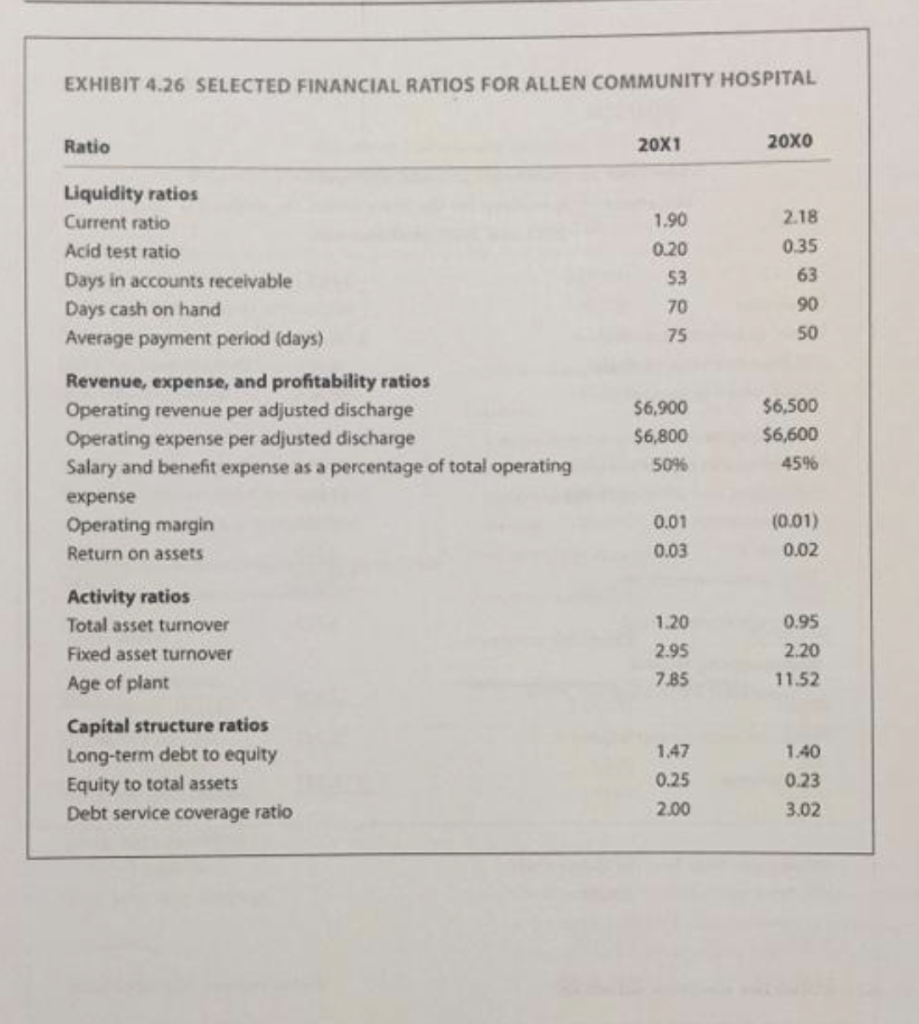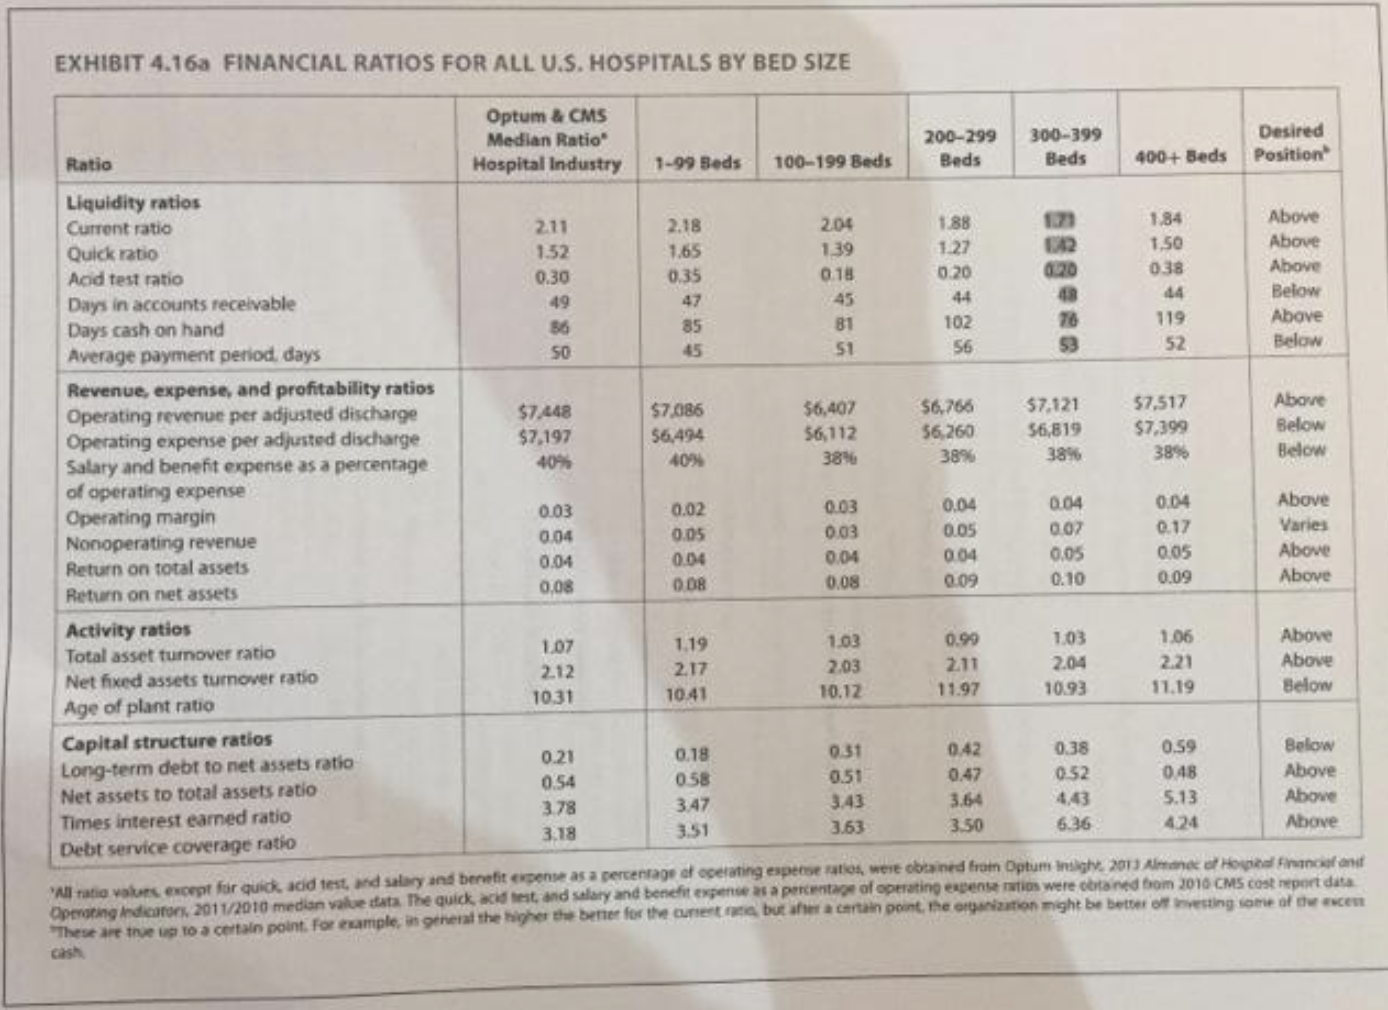


20. Ratio analysis. Allen Community Hospital is a small, 95-bed hospital. The hospital just completed a major renovation of its facility, which has helped to attract new physi- cians and patients to the hospital. Assess Allen's revenue, expense, and profitability; liquidity; activity; and capital structure ratios. Using the financial ratios from Exhibit 4.26 for the current and previous years, evaluate Allen's financial condition and also compare its ratios to national industry benchmarks for its bed size, using the data from Exhibits 4.16a. EXHIBIT 4.26 SELECTED FINANCIAL RATIOS FOR ALLEN COMMUNITY HOSPITAL Ratio 20x1 20x0 1.90 0.20 53 70 75 2.18 0.35 63 90 50 Liquidity ratios Current ratio Acid test ratio Days in accounts receivable Days cash on hand Average payment period (days) Revenue, expense, and profitability ratios Operating revenue per adjusted discharge Operating expense per adjusted discharge Salary and benefit expense as a percentage of total operating expense Operating margin Return on assets $6,900 $6,800 5096 $6,500 $6,600 45% 0.01 0.03 (0.01) 0.02 1.20 2.95 7.85 0.95 2.20 11.52 Activity ratios Total asset turnover Fixed asset turnover Age of plant Capital structure ratios Long-term debt to equity Equity to total assets Debt service coverage ratio 1.47 0.25 2.00 1.40 0.23 3.02 EXHIBIT 4.16a FINANCIAL RATIOS FOR ALL U.S. HOSPITALS BY BED SIZE 204 Optum & CMS Median Ratio 200-299 300-399 Desired Ratio Hospital Industry 1-99 Beds 100-199 Beds Beds Beds 400+ Beds Position Liquidity ratios Current ratio 211 2.18 1.88 1.84 Above Quick ratio 1.52 1.65 139 1.27 A2 1.50 Above Acid test ratio 0.30 0.35 0.18 0.20 038 Above Days in accounts receivable 49 Below Days cash on hand 36 85 81 102 76 119 Above Average payment period days SO 45 51 56 59 52 Below Revenue, expense, and profitability ratios Operating revenue per adjusted discharge $7,448 $7,086 $6,407 56.766 $7.121 57,517 Above Operating expense per adjusted discharge $7,197 56,494 56,112 56,260 56,819 $7,399 Below Salary and benefit expense as a percentage 40% 38% 38% 3896 Below of operating expense Operating margin 0.03 0.02 0.03 0.04 0.04 0.04 Above Nonoperating revenue 0.04 0.05 0.03 0.05 007 0.17 Varies Return on total assets 0.04 0.04 0.04 0.04 0.05 0.05 Above Return on net assets 0.08 O DR 0.08 0.09 0.10 0.09 Above Activity ratios Total asset turnover ratio 107 1.19 1.03 0.99 1.03 1.06 Above Net fixed assets turnover ratio 2.12 2.17 2.03 211 2.04 2.21 Above Age of plant ratio 1031 10.41 10.12 11.97 1093 11.19 Below Capital structure ratios Long-term debt to net assets ratio 0.21 0.18 0.31 0.42 0.38 0.59 Below Net assets to total assets ratio 0.54 058 0.51 0.47 0.52 0.48 Above Times interest earned ratio 3.78 3.47 3.43 3.64 5.13 Above Debt service coverage ratio 3.18 3.51 3.63 3.50 6.36 Above All ratio valurs except for quick add test and salary and benefit expense as a percentage of operating espeses were obtained from Optum ingly2011 Alman Holiceland Operating indicators, 2011/2010 median value data The quick and test and salary and benefit expense a percentage of operating expense ratios were obta ned from 2016 CMS cost report de These are the up to a certain point for comple, in general the higher the better for the current but her a certain point mention might be better of the ting some of the scen 20. Ratio analysis. Allen Community Hospital is a small, 95-bed hospital. The hospital just completed a major renovation of its facility, which has helped to attract new physi- cians and patients to the hospital. Assess Allen's revenue, expense, and profitability; liquidity; activity; and capital structure ratios. Using the financial ratios from Exhibit 4.26 for the current and previous years, evaluate Allen's financial condition and also compare its ratios to national industry benchmarks for its bed size, using the data from Exhibits 4.16a. EXHIBIT 4.26 SELECTED FINANCIAL RATIOS FOR ALLEN COMMUNITY HOSPITAL Ratio 20x1 20x0 1.90 0.20 53 70 75 2.18 0.35 63 90 50 Liquidity ratios Current ratio Acid test ratio Days in accounts receivable Days cash on hand Average payment period (days) Revenue, expense, and profitability ratios Operating revenue per adjusted discharge Operating expense per adjusted discharge Salary and benefit expense as a percentage of total operating expense Operating margin Return on assets $6,900 $6,800 5096 $6,500 $6,600 45% 0.01 0.03 (0.01) 0.02 1.20 2.95 7.85 0.95 2.20 11.52 Activity ratios Total asset turnover Fixed asset turnover Age of plant Capital structure ratios Long-term debt to equity Equity to total assets Debt service coverage ratio 1.47 0.25 2.00 1.40 0.23 3.02 EXHIBIT 4.16a FINANCIAL RATIOS FOR ALL U.S. HOSPITALS BY BED SIZE 204 Optum & CMS Median Ratio 200-299 300-399 Desired Ratio Hospital Industry 1-99 Beds 100-199 Beds Beds Beds 400+ Beds Position Liquidity ratios Current ratio 211 2.18 1.88 1.84 Above Quick ratio 1.52 1.65 139 1.27 A2 1.50 Above Acid test ratio 0.30 0.35 0.18 0.20 038 Above Days in accounts receivable 49 Below Days cash on hand 36 85 81 102 76 119 Above Average payment period days SO 45 51 56 59 52 Below Revenue, expense, and profitability ratios Operating revenue per adjusted discharge $7,448 $7,086 $6,407 56.766 $7.121 57,517 Above Operating expense per adjusted discharge $7,197 56,494 56,112 56,260 56,819 $7,399 Below Salary and benefit expense as a percentage 40% 38% 38% 3896 Below of operating expense Operating margin 0.03 0.02 0.03 0.04 0.04 0.04 Above Nonoperating revenue 0.04 0.05 0.03 0.05 007 0.17 Varies Return on total assets 0.04 0.04 0.04 0.04 0.05 0.05 Above Return on net assets 0.08 O DR 0.08 0.09 0.10 0.09 Above Activity ratios Total asset turnover ratio 107 1.19 1.03 0.99 1.03 1.06 Above Net fixed assets turnover ratio 2.12 2.17 2.03 211 2.04 2.21 Above Age of plant ratio 1031 10.41 10.12 11.97 1093 11.19 Below Capital structure ratios Long-term debt to net assets ratio 0.21 0.18 0.31 0.42 0.38 0.59 Below Net assets to total assets ratio 0.54 058 0.51 0.47 0.52 0.48 Above Times interest earned ratio 3.78 3.47 3.43 3.64 5.13 Above Debt service coverage ratio 3.18 3.51 3.63 3.50 6.36 Above All ratio valurs except for quick add test and salary and benefit expense as a percentage of operating espeses were obtained from Optum ingly2011 Alman Holiceland Operating indicators, 2011/2010 median value data The quick and test and salary and benefit expense a percentage of operating expense ratios were obta ned from 2016 CMS cost report de These are the up to a certain point for comple, in general the higher the better for the current but her a certain point mention might be better of the ting some of the scen


