Answered step by step
Verified Expert Solution
Link Copied!

Question

1 Approved Answer

2008 2009 2010 Difference from 2009 to 2010 45,000 Current Assets 30,000 17,500 Non- Current Assets 70,000 60,000 30,000 Total Farm Assets Current Liabilities 5,000
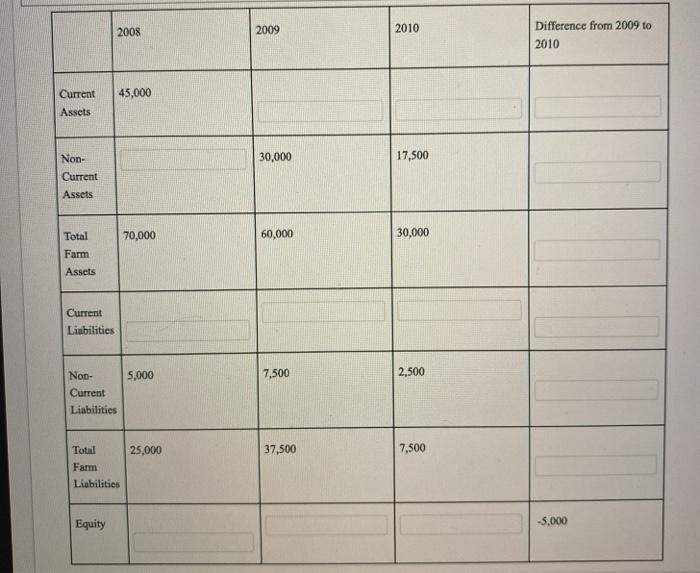
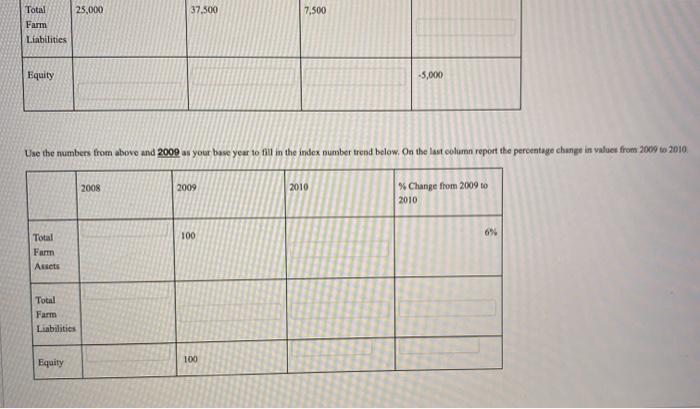
image text in transcribed
2008 2009 2010 Difference from 2009 to 2010 45,000 Current Assets 30,000 17,500 Non- Current Assets 70,000 60,000 30,000 Total Farm Assets Current Liabilities 5,000 7,500 2,500 Non- Current Liabilities 25,000 37,500 7,500 Total Farm Liabilities Equity -5,000 25,000 37,500 7,500 Total Farm Liabilities Equity -5,000 Use the numbers from above and 2009 as your base year to fill in the index number trend below. On the last column report the percentage change in values from 2009 to 2010 2008 2009 2010 % Change from 2009 to 2010 100 6% Total Farm Assets Total Farm Liabilities 100 Equity

Step by Step Solution

There are 3 Steps involved in it

Step: 1

blur-text-image

Get Instant Access to Expert-Tailored Solutions

See step-by-step solutions with expert insights and AI powered tools for academic success

Step: 2

blur-text-image

Step: 3

blur-text-image

Ace Your Homework with AI

Get the answers you need in no time with our AI-driven, step-by-step assistance

Get Started

Recommended Textbook for

Passive Activity Loss IRS Audit Technique Guide

Authors: Internal Revenue Service

1st Edition

1304114325, 978-1304114327

More Books

Students also viewed these Accounting questions