Answered step by step
Verified Expert Solution
Question
1 Approved Answer
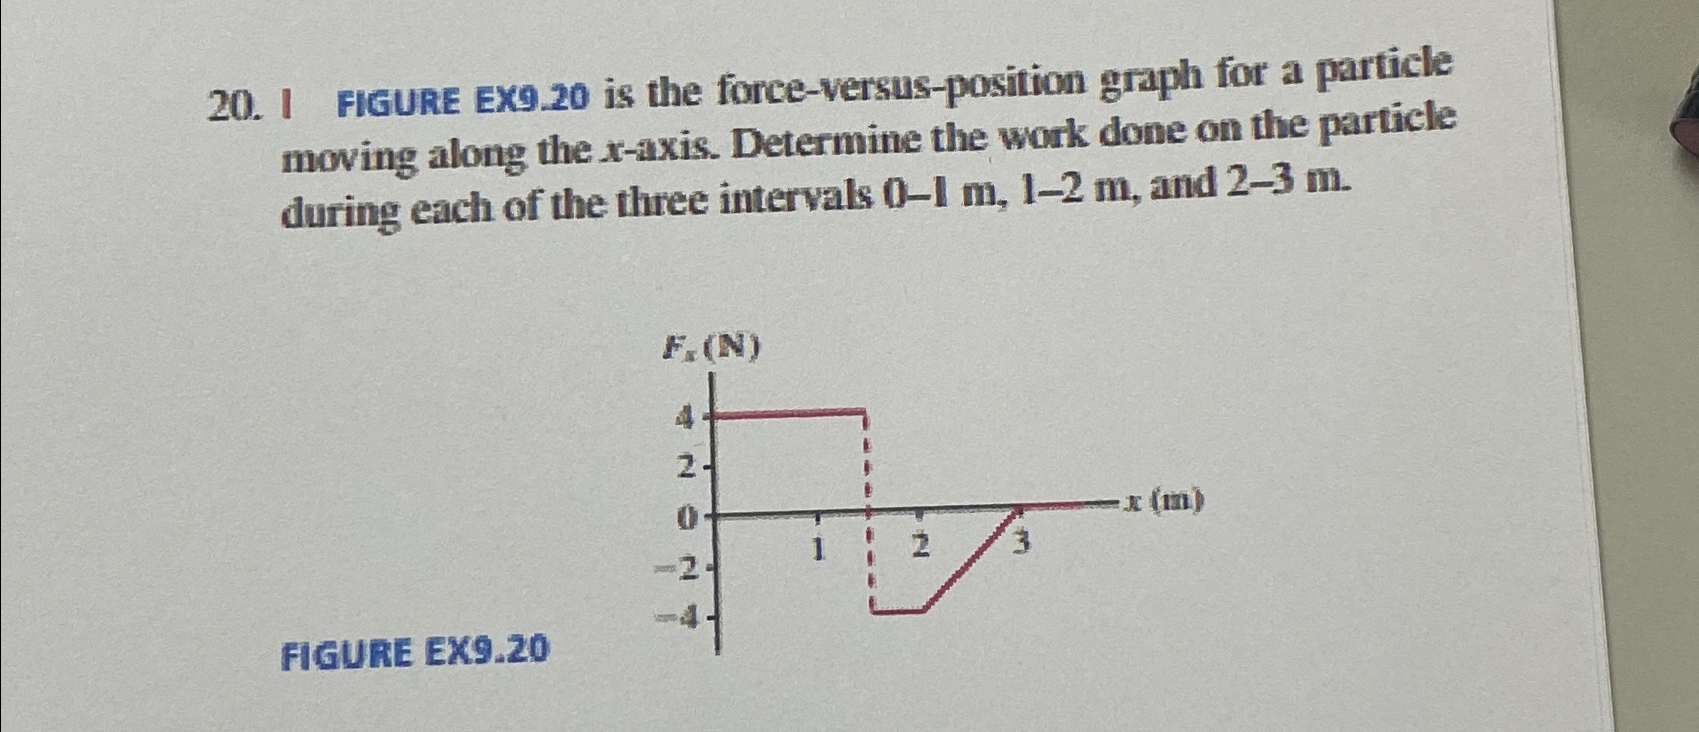
20.1 FIGURE EX9.20 is the force-versus-position graph for a particle moving along the x-axis. Determine the work done on the particle during each of

20.1 FIGURE EX9.20 is the force-versus-position graph for a particle moving along the x-axis. Determine the work done on the particle during each of the three intervals 0-1 m, 1-2 m, and 2-3 m. FIGURE EX9.20 F. (N) 4 2- 1 N -x (m) 3
Step by Step Solution
★★★★★
3.42 Rating (149 Votes )
There are 3 Steps involved in it
Step: 1
To determine the work done on the particle during each of the three intervals we can calculate the a...
Get Instant Access to Expert-Tailored Solutions
See step-by-step solutions with expert insights and AI powered tools for academic success
Step: 2

Step: 3

Document Format ( 2 attachments)
663d9b9519698_964526.pdf
180 KBs PDF File
663d9b9519698_964526.docx
120 KBs Word File
Ace Your Homework with AI
Get the answers you need in no time with our AI-driven, step-by-step assistance
Get Started


