Answered step by step
Verified Expert Solution
Question
1 Approved Answer
2020 2019 2018 2017 (a) 2016 FINANCIAL RESULTS (in millions) Sales Other revenue Total revenue $ 92,400 $ 77,130 $ 74,433 $ 71,786 $

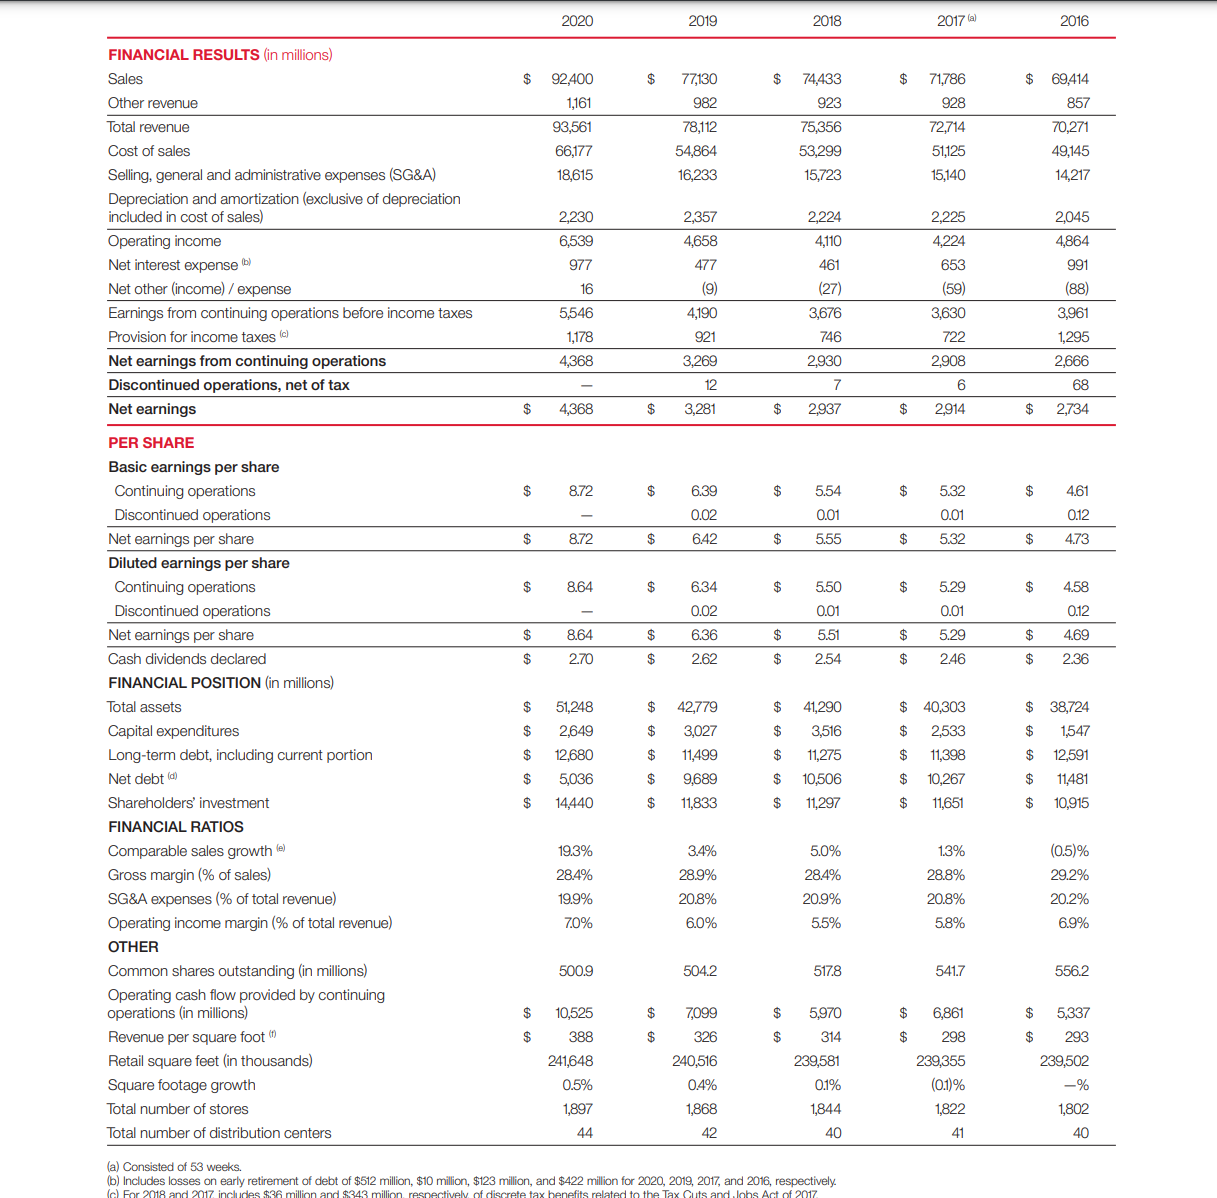
2020 2019 2018 2017 (a) 2016 FINANCIAL RESULTS (in millions) Sales Other revenue Total revenue $ 92,400 $ 77,130 $ 74,433 $ 71,786 $ 69,414 1,161 982 923 928 857 93,561 78,112 75,356 72,714 70,271 Cost of sales 66,177 54,864 53,299 51,125 49,145 Selling, general and administrative expenses (SG&A) 18,615 16,233 15,723 15,140 14,217 Depreciation and amortization (exclusive of depreciation included in cost of sales) 2,230 2,357 2,224 2,225 2,045 Operating income 6,539 4,658 4,110 4,224 4,864 Net interest expense (b) 977 477 461 653 991 Net other (income)/expense 16 (9) (27) (59) (88) Earnings from continuing operations before income taxes 5,546 4,190 3,676 3,630 3,961 Provision for income taxes (c) 1,178 921 746 722 1,295 Net earnings from continuing operations 4,368 3,269 2,930 2,908 2,666 Discontinued operations, net of tax 12 7 6 68 Net earnings $ 4,368 $ 3,281 $ 2,937 $ 2,914 $ 2,734 PER SHARE Basic earnings per share Continuing operations Discontinued operations $ 8.72 $ 6.39 $ 5.54 $ 5.32 $ 4.61 0.02 0.01 0.01 0.12 Net earnings per share $ 8.72 $ 6.42 $ 5.55 $ 5.32 $ 4.73 Diluted earnings per share Continuing operations $ Discontinued operations Net earnings per share Cash dividends declared 8.64 $ 6.34 $ 5.50 $ 5.29 $ 4.58 0.02 0.01 0.01 0.12 $ 8.64 $ 2.70 $ AGA $ 6.36 $ 5.51 $ 5.29 $ 4.69 2.62 $ 2.54 $ 2.46 $ 2.36 FINANCIAL POSITION (in millions) Total assets $ 51,248 $ 42,779 $ 41,290 $ 40,303 $ 38,724 Capital expenditures $ 2,649 $ 3,027 $ 3,516 $ 2,533 $ 1,547 Long-term debt, including current portion $ 12,680 $ 11,499 $ 11,275 $ 11,398 $ 12,591 Net debt (d) $ 5,036 $ 9,689 $ 10,506 $ 10,267 $ 11,481 Shareholders' investment $ 14,440 $ 11,833 $ 11,297 $ 11,651 $ 10,915 FINANCIAL RATIOS Comparable sales growth 19.3% 3.4% 5.0% 1.3% (0.5)% Gross margin (% of sales) 28.4% 28.9% 28.4% 28.8% 29.2% SG&A expenses (% of total revenue) 19.9% 20.8% 20.9% 20.8% 20.2% Operating income margin (% of total revenue) 7.0% 6.0% 5.5% 5.8% 6.9% OTHER Common shares outstanding (in millions) 500.9 504.2 517.8 541.7 556.2 Operating cash flow provided by continuing operations (in millions) $ 10,525 $ 7,099 $ 5,970 $ 6,861 $ 5,337 Revenue per square foot (1) $ 388 $ 326 $ 314 $ 298 $ 293 Retail square feet (in thousands) Square footage growth 241,648 0.5% 240,516 239,581 239,355 239,502 0.4% 0.1% (0.1)% -% Total number of stores 1.897 Total number of distribution centers 44 1,868 42 1,844 1,822 1,802 40 41 40 (a) Consisted of 53 weeks. (b) Includes losses on early retirement of debt of $512 million, $10 million, $123 million, and $422 million for 2020, 2019, 2017, and 2016, respectively. (c) For 2018 and 2017 includes $36 million and $343 million, respectively of discrete tax benefits related to the Tax Cuts and Jobs Act of 2017
Step by Step Solution
There are 3 Steps involved in it
Step: 1

Get Instant Access to Expert-Tailored Solutions
See step-by-step solutions with expert insights and AI powered tools for academic success
Step: 2

Step: 3

Ace Your Homework with AI
Get the answers you need in no time with our AI-driven, step-by-step assistance
Get Started


