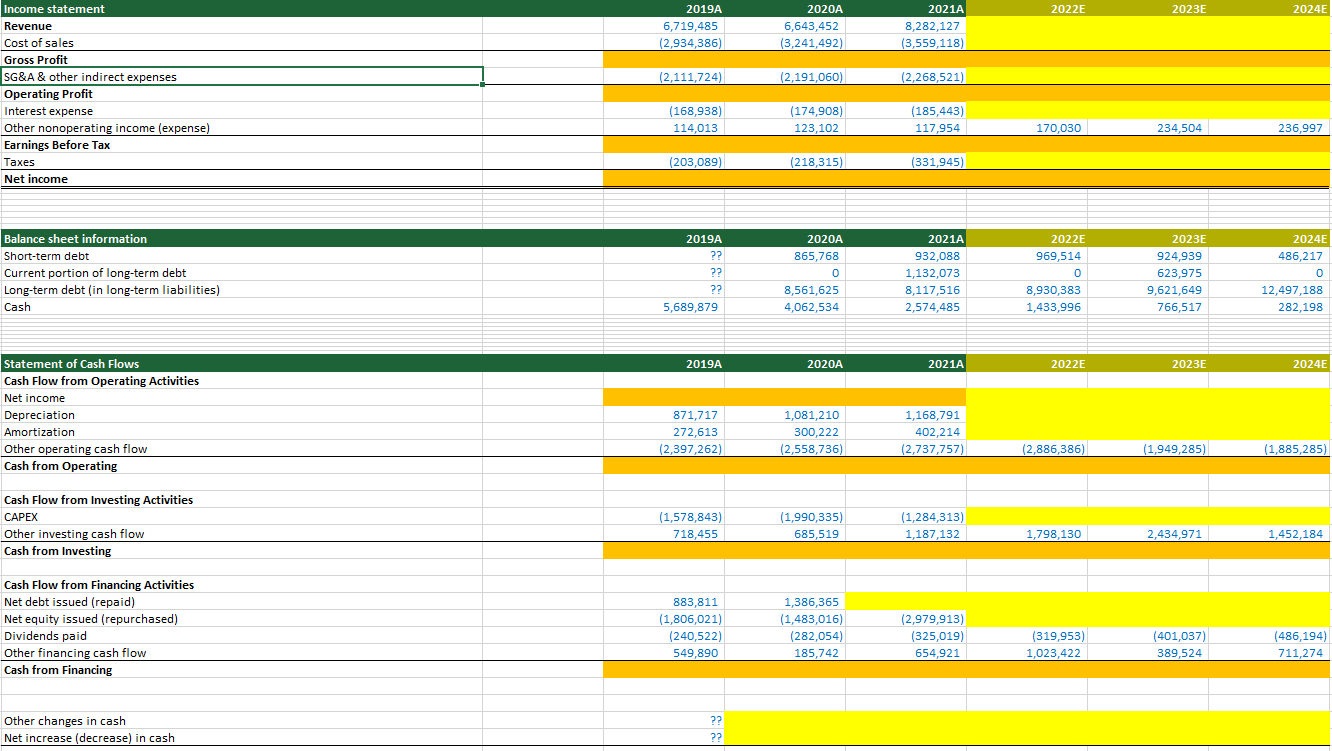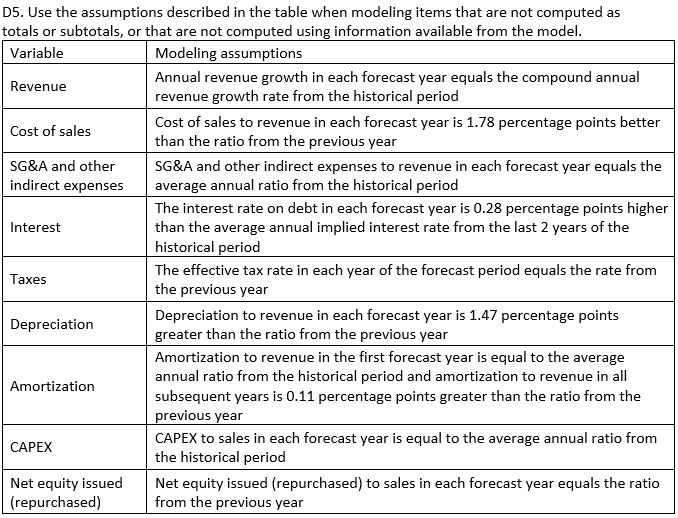

2022 2023E 2024E 2019A 6,719,485 (2,934,386) 2020A 6,643,452 (3,241,492) 2021A 8,282,127 (3,559,118) (2,111,724) (2,191,060) (2,268,521) Income statement Revenue Cost of sales Gross Profit SG&A & other indirect expenses Operating Profit Interest expense Other nonoperating income (expense) Earnings Before Tax Taxes Net income (168,938) 114,013 (174,908) 123,102 (185,443) 117,954 170,030 234,504 236,997 (203.089) (218,315) (331,945) Balance sheet information Short-term debt Current portion of long-term debt Long-term debt (in long-term liabilities) Cash 2019A ?? ?? ?? 5,689,879 2020A 865,768 0 8,561,625 4,062,534 2021A 932,088 1,132,073 8,117,516 2,574,485 2022E 969,514 0 8,930,383 1,433,996 2023E 924,939 623,975 9,621,649 766,517 2024E 486,217 0 12,497,188 282,198 2019A 2020A 2021A 2022 2023E 2024E Statement of Cash Flows Cash Flow from Operating Activities Net income Depreciation Amortization Other operating cash flow Cash from Operating 871,717 272,613 (2,397,262) 1,081,210 300,222 (2,558,736) 1,168,791 402,214 (2,737,757) (2,886,386) (1,949,285) (1,885,285) Cash Flow from Investing Activities CAPEX Other investing cash flow Cash from Investing (1,578,843) 718,455 (1,990,335) 685,519 (1,284,313) 1,187,132 1,798,130 2,434,971 1,452,184 Cash Flow from Financing Activities Net debt issued (repaid) Net equity issued (repurchased) Dividends paid Other financing cash flow Cash from Financing 883,811 (1,806,021) (240,522) 549,890 1,386,365 (1,483,016) (282,054) 185,742 (2,979,913) (325,019) 654,921 (319,953) 1,023,422 (401,037) 389,524 (486,194) 711,274 Other changes in cash Net increase (decrease) in cash ?? ?? D5. Use the assumptions described in the table when modeling items that are not computed as totals or subtotals, or that are not computed using information available from the model. Variable Modeling assumptions Annual revenue growth in each forecast year equals the compound annual Revenue revenue growth rate from the historical period Cost of sales Cost of sales to revenue in each forecast year is 1.78 percentage points better than the ratio from the previous year SG&A and other SG&A and other indirect expenses to revenue in each forecast year equals the indirect expenses average annual ratio from the historical period The interest rate on debt in each forecast year is 0.28 percentage points higher Interest than the average annual implied interest rate from the last 2 years of the historical period The effective tax rate in each year of the forecast period equals the rate from Taxes the previous year Depreciation to revenue in each forecast year is 1.47 percentage points Depreciation greater than the ratio from the previous year Amortization to revenue in the first forecast year is equal to the average annual ratio from the historical period and amortization to revenue in all Amortization subsequent years is 0.11 percentage points greater than the ratio from the previous year CAPEX CAPEX to sales in each forecast year is equal to the average annual ratio from the historical period Net equity issued Net equity issued (repurchased) to sales in each forecast year equals the ratio (repurchased) from the previous year 2022 2023E 2024E 2019A 6,719,485 (2,934,386) 2020A 6,643,452 (3,241,492) 2021A 8,282,127 (3,559,118) (2,111,724) (2,191,060) (2,268,521) Income statement Revenue Cost of sales Gross Profit SG&A & other indirect expenses Operating Profit Interest expense Other nonoperating income (expense) Earnings Before Tax Taxes Net income (168,938) 114,013 (174,908) 123,102 (185,443) 117,954 170,030 234,504 236,997 (203.089) (218,315) (331,945) Balance sheet information Short-term debt Current portion of long-term debt Long-term debt (in long-term liabilities) Cash 2019A ?? ?? ?? 5,689,879 2020A 865,768 0 8,561,625 4,062,534 2021A 932,088 1,132,073 8,117,516 2,574,485 2022E 969,514 0 8,930,383 1,433,996 2023E 924,939 623,975 9,621,649 766,517 2024E 486,217 0 12,497,188 282,198 2019A 2020A 2021A 2022 2023E 2024E Statement of Cash Flows Cash Flow from Operating Activities Net income Depreciation Amortization Other operating cash flow Cash from Operating 871,717 272,613 (2,397,262) 1,081,210 300,222 (2,558,736) 1,168,791 402,214 (2,737,757) (2,886,386) (1,949,285) (1,885,285) Cash Flow from Investing Activities CAPEX Other investing cash flow Cash from Investing (1,578,843) 718,455 (1,990,335) 685,519 (1,284,313) 1,187,132 1,798,130 2,434,971 1,452,184 Cash Flow from Financing Activities Net debt issued (repaid) Net equity issued (repurchased) Dividends paid Other financing cash flow Cash from Financing 883,811 (1,806,021) (240,522) 549,890 1,386,365 (1,483,016) (282,054) 185,742 (2,979,913) (325,019) 654,921 (319,953) 1,023,422 (401,037) 389,524 (486,194) 711,274 Other changes in cash Net increase (decrease) in cash ?? ?? D5. Use the assumptions described in the table when modeling items that are not computed as totals or subtotals, or that are not computed using information available from the model. Variable Modeling assumptions Annual revenue growth in each forecast year equals the compound annual Revenue revenue growth rate from the historical period Cost of sales Cost of sales to revenue in each forecast year is 1.78 percentage points better than the ratio from the previous year SG&A and other SG&A and other indirect expenses to revenue in each forecast year equals the indirect expenses average annual ratio from the historical period The interest rate on debt in each forecast year is 0.28 percentage points higher Interest than the average annual implied interest rate from the last 2 years of the historical period The effective tax rate in each year of the forecast period equals the rate from Taxes the previous year Depreciation to revenue in each forecast year is 1.47 percentage points Depreciation greater than the ratio from the previous year Amortization to revenue in the first forecast year is equal to the average annual ratio from the historical period and amortization to revenue in all Amortization subsequent years is 0.11 percentage points greater than the ratio from the previous year CAPEX CAPEX to sales in each forecast year is equal to the average annual ratio from the historical period Net equity issued Net equity issued (repurchased) to sales in each forecast year equals the ratio (repurchased) from the previous year


