

Answered step by step
Verified Expert Solution
Question
1 Approved Answer
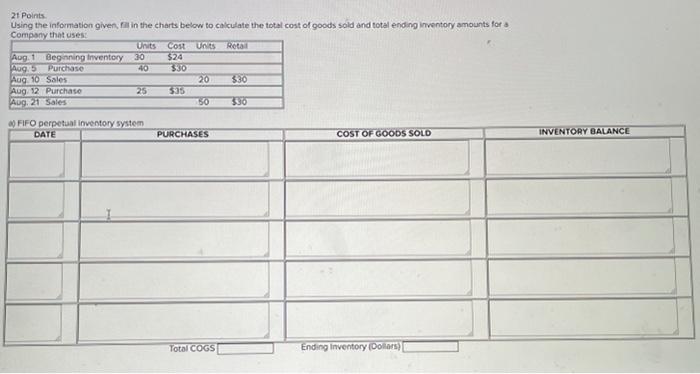
21 Points Using the information given in the charts below to calculate the total cost of goods sold and total ending inventory amounts for Company
Step by Step Solution
There are 3 Steps involved in it
Step: 1

Get Instant Access to Expert-Tailored Solutions
See step-by-step solutions with expert insights and AI powered tools for academic success
Step: 2

Step: 3
Ace Your Homework with AI
Get the answers you need in no time with our AI-driven, step-by-step assistance
Get Started
Audit Findings Of RAC MAC HAC And PSI Review Process
Authors: Mrs. Jyoti Sharma
1st Edition
1511689609, 978-1511689601