

Answered step by step
Verified Expert Solution
Question
1 Approved Answer
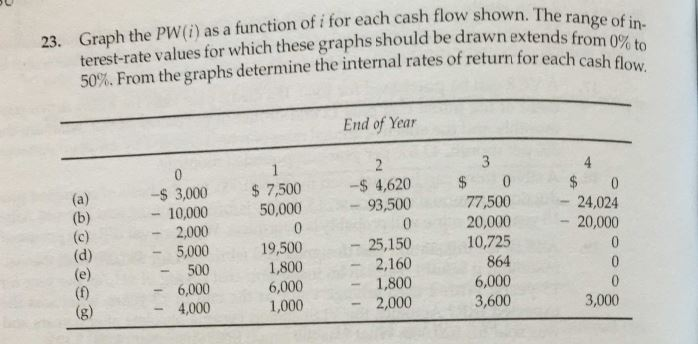
23. Graph the PW() as a function of i for each cash flow shown. The range of terest-rate values for which these graphs should be
Step by Step Solution
There are 3 Steps involved in it
Step: 1

Get Instant Access to Expert-Tailored Solutions
See step-by-step solutions with expert insights and AI powered tools for academic success
Step: 2

Step: 3
Ace Your Homework with AI
Get the answers you need in no time with our AI-driven, step-by-step assistance
Get Started
Principles Of Managerial Finance
Authors: Lawrence J. Gitman, Chad J. Zutter
13th Edition
9780132738729, 136119468, 132738724, 978-0136119463