Answered step by step
Verified Expert Solution
Link Copied!

Question

1 Approved Answer

23456 7 88 78 9 81 10 75 11 68 12 69 1. Plot a graph (2 points) 2. Use interpolation to estimate the temperature
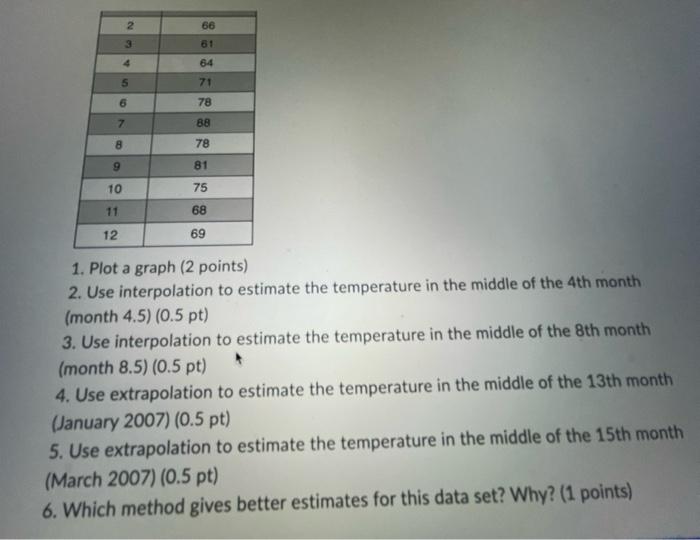
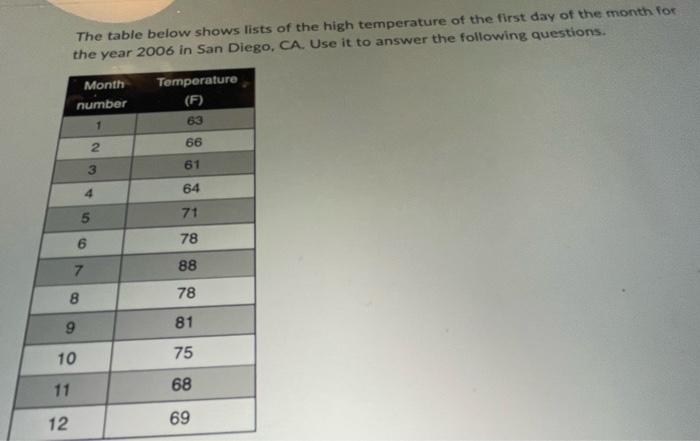
image text in transcribed
23456 7 88 78 9 81 10 75 11 68 12 69 1. Plot a graph (2 points) 2. Use interpolation to estimate the temperature in the middle of the 4th month (month 4.5) (0.5 pt) 3. Use interpolation to estimate the temperature in the middle of the 8th month (month 8.5) (0.5 pt) 4. Use extrapolation to estimate the temperature in the middle of the 13th month (January 2007) (0.5 pt) 5. Use extrapolation to estimate the temperature in the middle of the 15th month (March 2007) (0.5 pt) 6. Which method gives better estimates for this data set? Why? (1 points) 8 66 61 64 71 78 The table below shows lists of the high temperature of the first day of the month for the year 2006 in San Diego, CA. Use it to answer the following questions. Temperature Month number (F) 1 63 2 11 12 8 9 10 3 4 5 6 7 66 61 64 71 78 88 78 81 75 68 69

Step by Step Solution

There are 3 Steps involved in it

Step: 1

blur-text-image

Get Instant Access to Expert-Tailored Solutions

See step-by-step solutions with expert insights and AI powered tools for academic success

Step: 2

blur-text-image_2

Step: 3

blur-text-image_3

Ace Your Homework with AI

Get the answers you need in no time with our AI-driven, step-by-step assistance

Get Started

Recommended Textbook for

Chemical Process Safety Fundamentals With Applications

Authors: Daniel A. Crowl, Joseph F. Louvar

3rd Edition

0131382268, 978-0131382268

More Books

Students also viewed these Chemical Engineering questions