

Question
24. Horizontal, vertical, and ratio analyses. exhibits 4.30a and 4.30b show the balance sheet and income statement for the 660-bed Williams Academic Medical Center for
24. Horizontal, vertical, and ratio analyses. exhibits 4.30a and 4.30b show the balance sheet and income statement for the 660-bed Williams Academic Medical Center for the years 20X0 and 20X1. Assume that principal payments each year come to $5,500,000 and that adjusted discharges are 120,000 for 20X0 and 125,000 for 20X1.
a) Perform full horizontal and vertical analyses on the balance sheet. b) Perform full horizontal and vertical analyses on the income statement. c) Calculate every ratio described in the chapter for both years, and compare these ratios with the benchmarks (Exhibit 4.16a).
Discuss William's current financial position and future outlook based on these results. Make the basis for the vertical analysis the year 20X0.
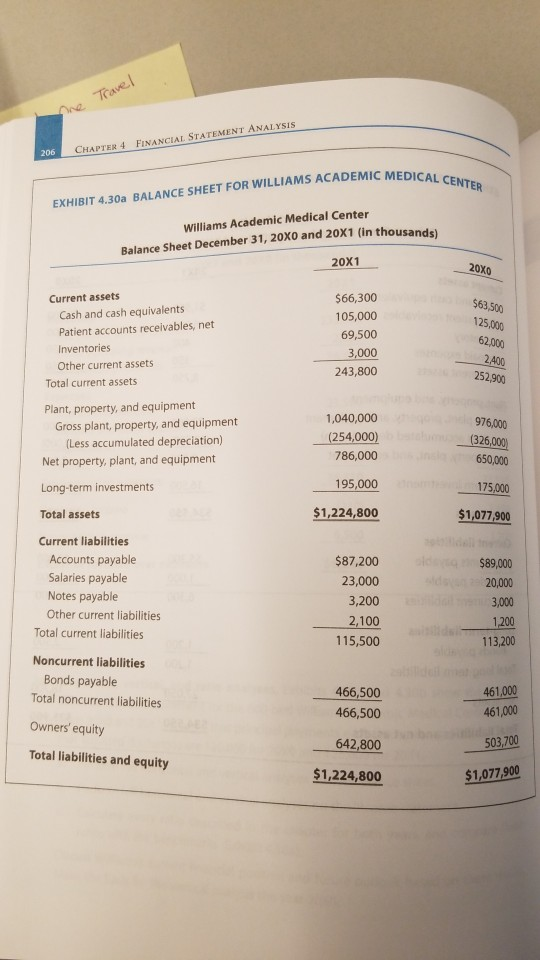
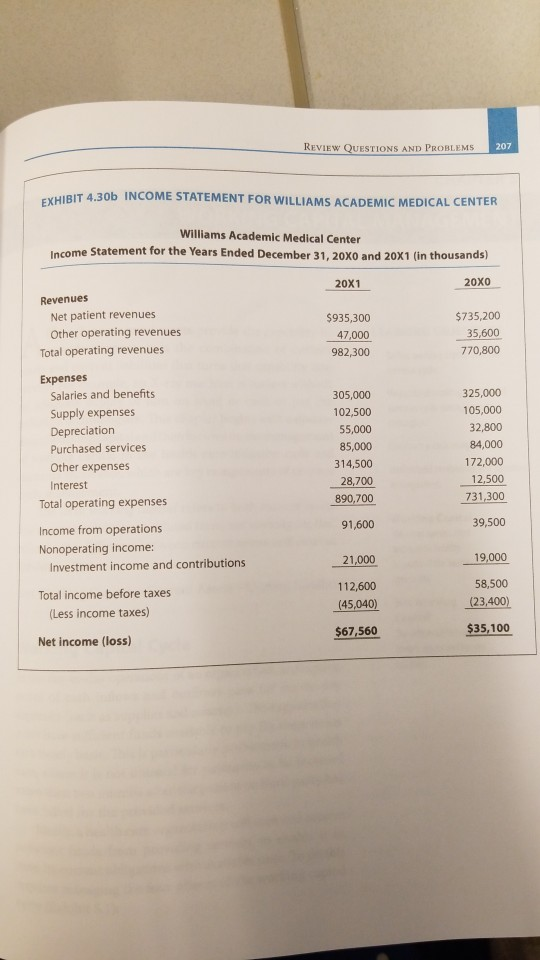
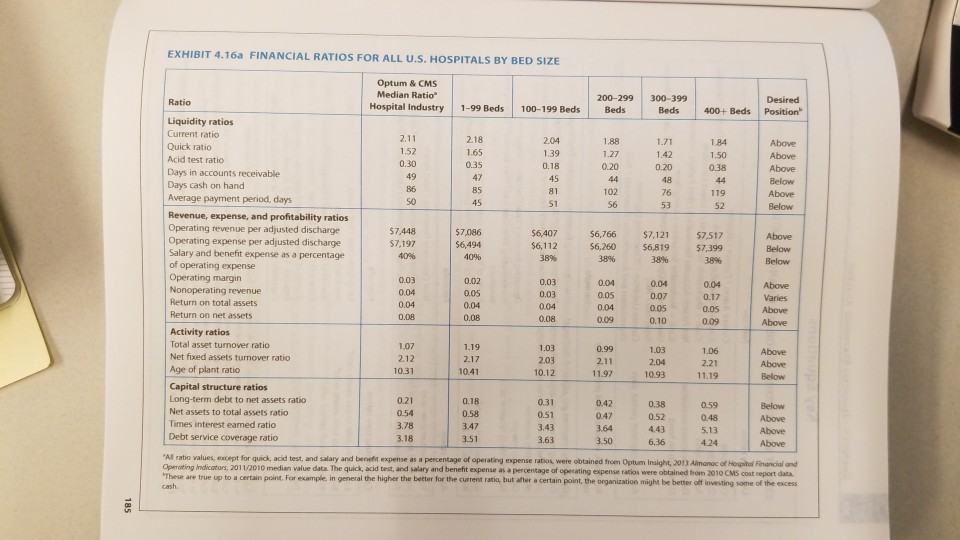
Travel 206 CHAPTER 4 FINANCIAL STATEMENT ANALYSIS EDICAL CENTER EXHIBIT 4.30a BALANCE SHEET FOR WILLIAMS ACADEMIC Williams Academic Medical Center Balance Sheet December 31, 20X0 and 20X1 (in thousands) 20X1 20X0 Current assets Cash and cash equivalents Patient accounts receivables, net Inventories Other current assets Total current assets $66,300 105,000 69,500 3,000 243,800 $63,500 125.000 62.000 2400 252,900 Plant, property, and equipment Gross plant, property, and equipment (Less accumulated depreciation) Net property, plant, and equipment 1,040,000 (254,000) 786,000 976,000 (326,000) 650,000 Long-term investments 195,000 175,000 Total assets $1,224,800 $1,077,900 Current liabilities Accounts payable Salaries payable Notes payable Other current liabilities Total current liabilities loq od $87,200 23,000 3,200 2,100 115,500 $89,000 20,000 3,000 1,200 113,200 Noncurrent liabilities Bonds payable Total noncurrent liabilities 461,000 466,500 466,500 461,000 Owners' equity 642,800 503,700 Total liabilities and equity $1,224,800 $1,077,900 REVIEW OUESTIONS AND PROBLEMS 207 HIBIT 4.30b INCOME STATEMENT FOR WILLIAMS ACADEMIC MEDICAL CENTER Williams Academic Medical Center Income Statement for the Years Ended December 31, 20X0 and 20X1 (in thousands) 20X1 20x0 Revenues Net patient revenues $935,300 $735,200 Other operating revenues 47,000 35,600 Total operating revenues 982,300 770,800 Expenses Salaries and benefits Supply expenses Depreciation Purchased services Other expenses Interest Total operating expenses 305,000 102,500 55,000 85,000 314,500 28,700 890,700 325,000 105,000 32,800 84,000 172,000 12,500 731,300 91,600 39,500 Income from operations Nonoperating income: Investment income and contributions 21,000 19,000 Total income before taxes (Less income taxes) 112,600 (45,040) 58,500 (23,400) $67,560 $35,100 Net income (loss) EXHIBIT 4.16a FINANCIAL RATIOS FOR ALL U.S. HOSPITALS BY BED SIZE Optum & CMS Median Ratio Hospital Industry Ratio 1-99 Beds 100-199 Beds 200-299 Beds 300-399 Beds Desired Position 400+ Beds 2.18 1.65 1.84 2.11 1.52 0.30 49 2.04 1.39 0,18 1.88 1.27 0.20 1.71 1.42 0.20 1.50 035 038 Above Above Above Below Above Below 18 36 76 102 56 119 52 57 53 Liquidity ratios Current ratio Quick ratio Acid test ratio Days in accounts receivable Days cash on hand Average payment period, days Revenue, expense, and profitability ratios Operating revenue per adjusted discharge Operating expense per adjusted discharge Salary and benefit expense as a percentage of operating expense Operating margin Nonoperating revenue Return on total assets Return on net assets $7448 $7,197 40% $7,086 $6,494 40% 56,407 $6,112 38% 56,766 $6.260 38% 57,121 $6,819 38% $7,517 $7,399 Above Below Below 0.03 0.02 0.04 0.04 0.04 0.17 0.03 0.03 0.04 0.08 0.05 0.04 0.08 0.04 0.07 0.05 0.10 0.05 0.04 0.09 0.04 0.08 Above Varies Above Above 0.05 0.09 1.07 1.19 2.12 2.17 1.03 2.03 10.12 0.99 2.11 11.97 1.03 2.04 10.93 1.06 2.21 11.19 Above Above Below 10.31 10.41 Activity ratios Total asset turnover ratio Net fixed assets turnover ratio Age of plant ratio Capital structure ratios Long-term debt to net assets ratio Net assets to total assets ratio Times interest eamed ratio Debt service coverage ratio 0.21 0.18 0.31 0.42 0.59 054 058 051 Below Above 0.38 0.52 4.43 6.336 3.47 351 5.13 4.24 3.63 Above Above 3.50 Al ratio values, except for quick, acid test, and salary and benefit expense as a percentage of operating expense ratios were obtained from Optum Insight, 2013 Almanac of Hospital Financial and Operating Indicators, 2011/2010 median value data. The quick, acid test, and salary and benefit expense as a percentage of operating expense ratios were obtained from 2010 CMS cost report data These are true up to a certain point. For example, in general the higher the better for the current ratio, butter a certain point, the organization might be better off investing some of the excess cash
Step by Step Solution
There are 3 Steps involved in it
Step: 1

Get Instant Access to Expert-Tailored Solutions
See step-by-step solutions with expert insights and AI powered tools for academic success
Step: 2

Step: 3
Ace Your Homework with AI
Get the answers you need in no time with our AI-driven, step-by-step assistance
Get Started
Gleim CIA Review Part 3 Internal Audit Knowledge Elements
Authors: Irvin N. Gleim
2018 Edition
1618541153, 978-1618541154