

Answered step by step
Verified Expert Solution
Question
1 Approved Answer
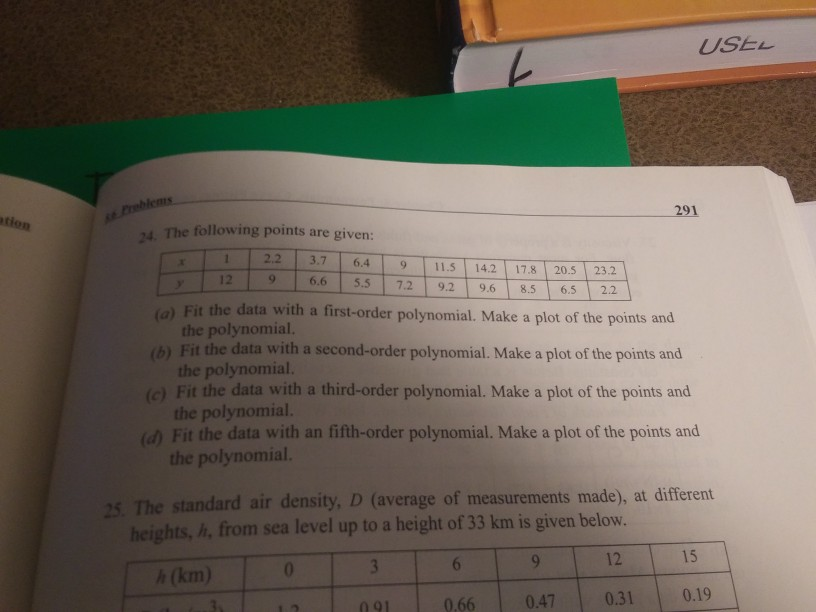
#24 PLOT (a)-(d) IN ONE GRAPH USING SUBPLOT IN MATLAB USEL Preblems 291 ation The following points are given: 1 2 .2 3.7 6. 4
#24 PLOT (a)-(d) IN ONE GRAPH USING SUBPLOT IN MATLAB
USEL Preblems 291 ation The following points are given: 1 2 .2 3.7 6. 4 9 11.5 14.2 17.8 20.5 23.2 12 9 6 .6 5.5 7.2 9.2 9.6 8.5 6.5 2.2 Fit the data with a first-order polynomial. Make a plot of the points and the polynomial (b) Fit the data with a second-order polynomial. Make a plot of the points and the polynomial. Fit the data with a third-order polynomial. Make a plot of the points and the polynomial. Fit the data with an fifth-order polynomial. Make a plot of the points and the polynomial 2. The standard air density, D (average of measurements made), at different heights. h. from sea level up to a height of 33 km is given below. h (km) 9 12 15 12 091 066 0.47 0.31 0.19Step by Step Solution
There are 3 Steps involved in it
Step: 1

Get Instant Access to Expert-Tailored Solutions
See step-by-step solutions with expert insights and AI powered tools for academic success
Step: 2

Step: 3
Ace Your Homework with AI
Get the answers you need in no time with our AI-driven, step-by-step assistance
Get Started
Rules In Database Systems Third International Workshop Rids 97 Sk Vde Sweden June 26 28 1997 Proceedings Lncs 1312
Authors: Andreas Geppert ,Mikael Berndtsson
1997th Edition
3540635165, 978-3540635161