Answered step by step
Verified Expert Solution
Question
1 Approved Answer
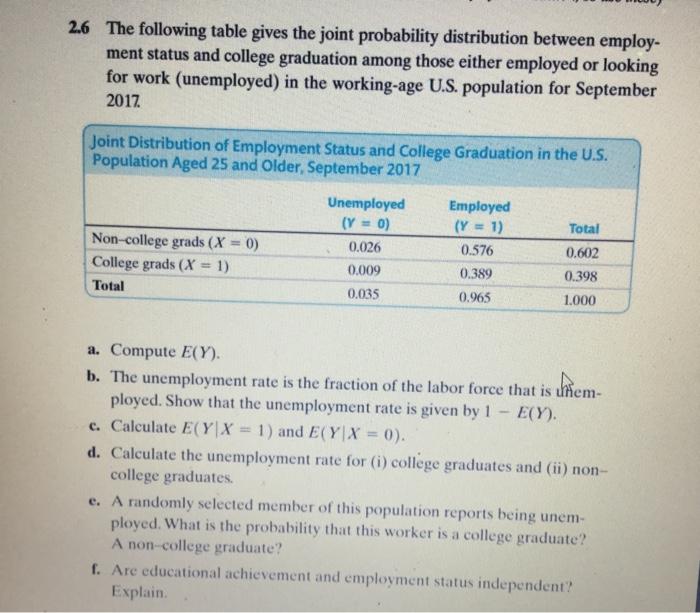
2.6 The following table gives the joint probability distribution between employ- ment status and college graduation among those either employed or looking for work

2.6 The following table gives the joint probability distribution between employ- ment status and college graduation among those either employed or looking for work (unemployed) in the working-age U.S. population for September 2017 Joint Distribution of Employment Status and College Graduation in the U.S. Population Aged 25 and Older, September 2017 Unemployed (Y = 0) Employed (Y = 1) Total Non-college grads (X = 0) College grads (X 0.026 0.576 0.602 %3D 1) 0.009 0.389 0.398 Total 0.035 0.965 1.000 a. Compute E(Y). b. The unemployment rate is the fraction of the labor force that is uhem- ployed. Show that the unemployment rate is given by 1 c. Calculate E(Y|X = 1) and E(Y|X = 0). E(Y). d. Calculate the unemployment rate for (i) college graduates and (ii) non- college graduates. e. A randomly selected member of this population reports being unem- ployed. What is the probability that this worker is a college graduate? A non-college graduate? f. Are educational achievement and employment status independent? Explain.
Step by Step Solution
★★★★★
3.31 Rating (142 Votes )
There are 3 Steps involved in it
Step: 1
ANSWER a omfute he expected Valve of y o IxeY 0965 b it is xeauired to ...
Get Instant Access to Expert-Tailored Solutions
See step-by-step solutions with expert insights and AI powered tools for academic success
Step: 2

Step: 3

Ace Your Homework with AI
Get the answers you need in no time with our AI-driven, step-by-step assistance
Get Started


